\n
## Diagram: Neuromorphic Computing Pipeline
### Overview
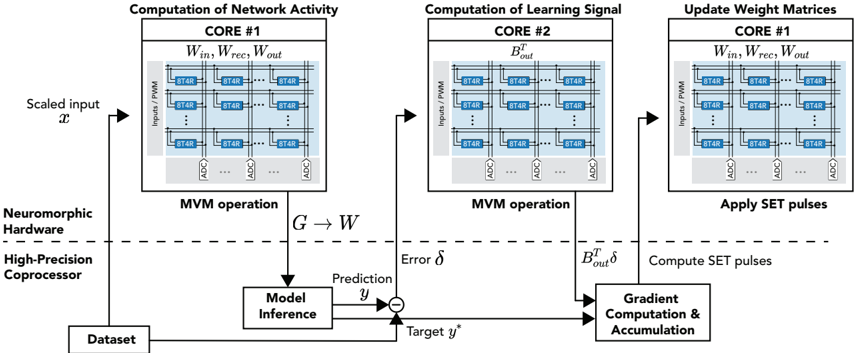
This diagram illustrates a pipeline for neuromorphic computing, specifically detailing the computation of network activity, learning signal, and weight matrix updates. The process involves three main cores and utilizes neuromorphic hardware and a high-precision coprocessor. The diagram shows the flow of data from a dataset through model inference, error calculation, gradient computation, and finally, weight updates.
### Components/Axes
The diagram is segmented into three main blocks representing the three cores:
1. **Computation of Network Activity (CORE #1):** Inputs/PWM, Win, Wrec, Wout, ADC.
2. **Computation of Learning Signal (CORE #2):** Inputs/PWM, Bout, ADC.
3. **Update Weight Matrices (CORE #1):** Inputs/PWM, Win, Wrec, Wout, ADC.
Additional components include:
* **Scaled Input (x):** The initial input data.
* **Neuromorphic Hardware:** The underlying hardware platform.
* **High-Precision Coprocessor:** Assists in computations.
* **Dataset:** The source of input data.
* **Model Inference:** The process of generating a prediction.
* **Prediction (y):** The output of the model.
* **Target (y*):** The desired output.
* **Error (δ):** The difference between prediction and target.
* **Gradient Computation & Accumulation:** Calculates the gradient of the error.
* **MVM Operation:** Matrix-Vector Multiplication.
* **G → W:** Represents the weight update process.
* **Boutδ:** Represents the learning signal.
### Detailed Analysis or Content Details
The diagram depicts a data flow.
1. **Scaled Input (x):** The process begins with a scaled input 'x' from a 'Dataset'. This input is fed into 'CORE #1' (Computation of Network Activity).
2. **CORE #1:** This core receives 'Inputs/PWM' and utilizes weight matrices 'Win', 'Wrec', and 'Wout'. The core contains multiple 'BT4R' blocks (approximately 8x8 grid) and 'ADC' (Analog-to-Digital Converter) components. The output of this core is fed into 'Model Inference'.
3. **Model Inference:** The 'Model Inference' block generates a 'Prediction' (y).
4. **Error Calculation:** The 'Prediction' (y) is compared to a 'Target' (y*) to calculate an 'Error' (δ).
5. **CORE #2:** The 'Error' (δ) is then fed into 'CORE #2' (Computation of Learning Signal), which also receives 'Inputs/PWM' and utilizes a weight matrix 'Bout'. Similar to CORE #1, it contains 'BT4R' blocks and 'ADC' components. The output of CORE #2 is 'Boutδ'.
6. **Gradient Computation & Accumulation:** 'Boutδ' is used in 'Gradient Computation & Accumulation'.
7. **Weight Update:** The output of 'Gradient Computation & Accumulation' is used to update the weight matrices 'Win', 'Wrec', and 'Wout' in 'CORE #1' (Update Weight Matrices) via the 'G → W' transformation. This core also receives 'Inputs/PWM', 'BT4R' blocks, and 'ADC' components. The update is applied using 'SET pulses'.
8. **MVM Operation:** Both CORE #1 and CORE #2 perform a 'MVM operation'.
The 'BT4R' blocks appear to represent individual processing elements within the cores. The 'ADC' components likely convert analog signals to digital values. The diagram does not provide specific numerical values for the weights or input signals.
### Key Observations
* The diagram highlights a closed-loop system where predictions are compared to targets, and the resulting error is used to update the weights.
* The use of 'SET pulses' suggests a spike-based or event-driven computation paradigm.
* The diagram emphasizes the role of neuromorphic hardware and a high-precision coprocessor in accelerating the computation.
* The repeated use of 'Inputs/PWM' suggests Pulse Width Modulation is used for input representation.
* The cores appear to have a similar structure, with a grid of 'BT4R' blocks and 'ADC' components.
### Interpretation
This diagram illustrates a simplified view of a neuromorphic computing system. The system aims to mimic the biological brain by using spiking neural networks and event-driven computation. The use of neuromorphic hardware and a high-precision coprocessor suggests an attempt to overcome the limitations of traditional von Neumann architectures for machine learning tasks. The pipeline demonstrates how input data is processed, predictions are made, errors are calculated, and weights are updated to improve the model's accuracy. The 'SET pulses' likely represent the mechanism for adjusting the synaptic weights in the neuromorphic hardware. The diagram suggests a focus on energy efficiency and parallel processing, which are key advantages of neuromorphic computing. The diagram does not provide details on the specific neural network architecture or the learning algorithm used. It is a high-level overview of the data flow and key components involved in the process.