## Bar Chart: Distribution of Good and Bad Answers by Model
### Overview
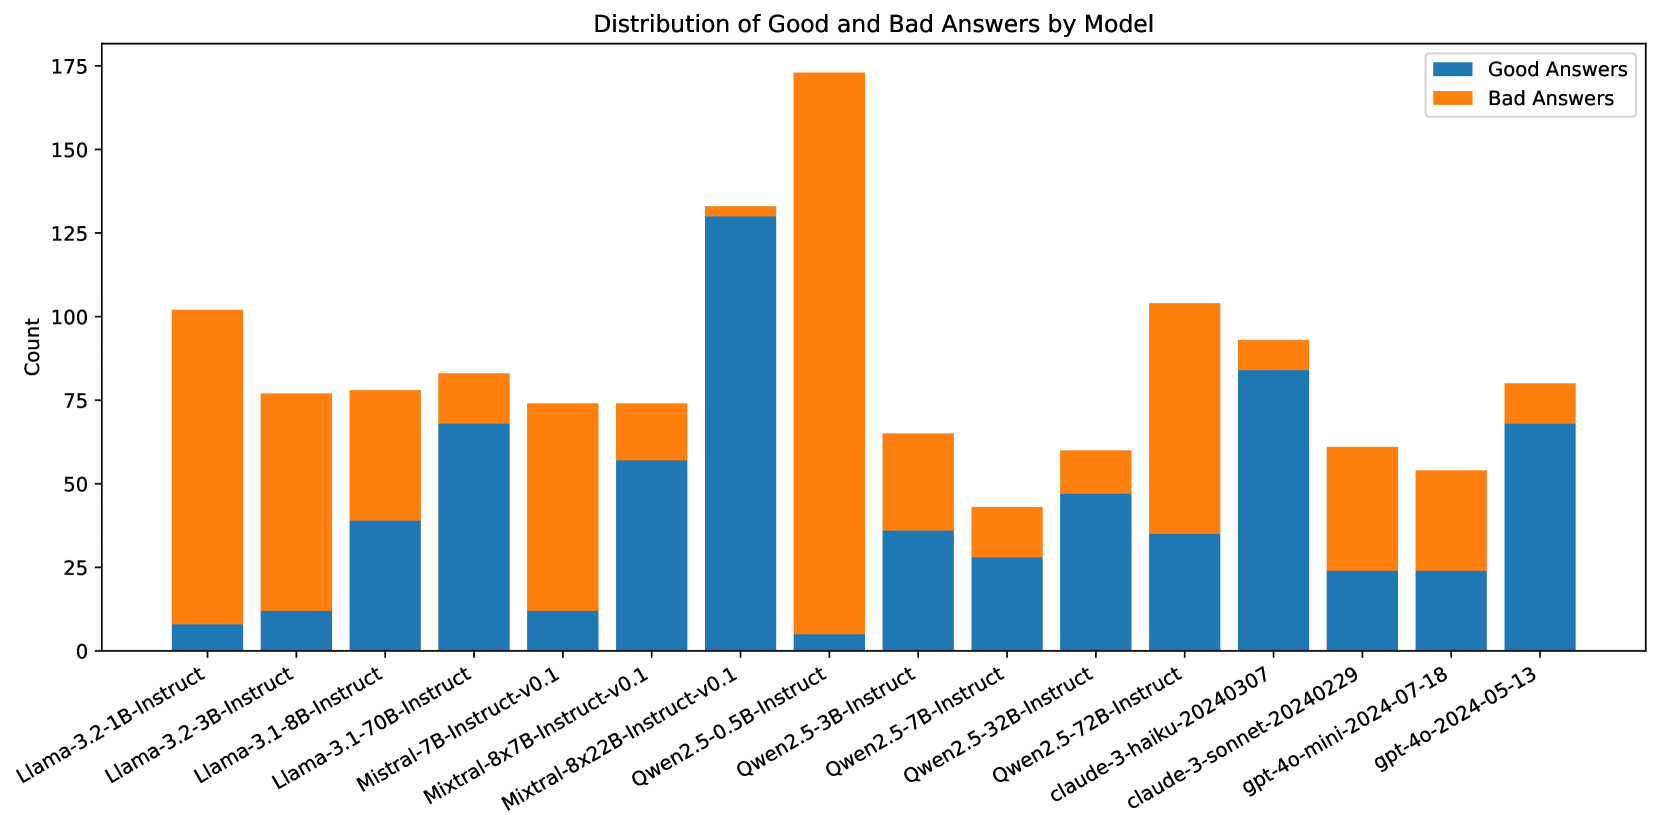
The image is a stacked bar chart comparing the number of "Good Answers" and "Bad Answers" generated by different language models. The x-axis represents the model names, and the y-axis represents the count of answers. Each bar is divided into two sections: a blue section representing "Good Answers" and an orange section representing "Bad Answers."
### Components/Axes
* **Title:** Distribution of Good and Bad Answers by Model
* **X-axis:** Model Names (listed below)
* **Y-axis:** Count, with scale markers at 0, 25, 50, 75, 100, 125, 150, and 175.
* **Legend:** Located in the top-right corner, indicating:
* Blue: Good Answers
* Orange: Bad Answers
### Detailed Analysis
Here's a breakdown of the data for each model, including the approximate counts of "Good Answers" and "Bad Answers":
1. **Llama-3.2-1B-Instruct:**
* Good Answers: Approximately 8
* Bad Answers: Approximately 95
2. **Llama-3.2-3B-Instruct:**
* Good Answers: Approximately 12
* Bad Answers: Approximately 65
3. **Llama-3.1-8B-Instruct:**
* Good Answers: Approximately 40
* Bad Answers: Approximately 38
4. **Llama-3.1-70B-Instruct:**
* Good Answers: Approximately 70
* Bad Answers: Approximately 15
5. **Mistral-7B-Instruct-v0.1:**
* Good Answers: Approximately 12
* Bad Answers: Approximately 62
6. **Mixtral-8x7B-Instruct-v0.1:**
* Good Answers: Approximately 60
* Bad Answers: Approximately 15
7. **Mixtral-8x22B-Instruct-v0.1:**
* Good Answers: Approximately 130
* Bad Answers: Approximately 45
8. **Qwen2.5-0.5B-Instruct:**
* Good Answers: Approximately 5
* Bad Answers: Approximately 170
9. **Qwen2.5-3B-Instruct:**
* Good Answers: Approximately 35
* Bad Answers: Approximately 30
10. **Qwen2.5-7B-Instruct:**
* Good Answers: Approximately 30
* Bad Answers: Approximately 15
11. **Qwen2.5-32B-Instruct:**
* Good Answers: Approximately 45
* Bad Answers: Approximately 15
12. **Qwen2.5-72B-Instruct:**
* Good Answers: Approximately 35
* Bad Answers: Approximately 70
13. **claude-3-haiku-20240307:**
* Good Answers: Approximately 85
* Bad Answers: Approximately 10
14. **claude-3-sonnet-20240229:**
* Good Answers: Approximately 25
* Bad Answers: Approximately 35
15. **gpt-4o-mini-2024-07-18:**
* Good Answers: Approximately 25
* Bad Answers: Approximately 30
16. **gpt-4o-2024-05-13:**
* Good Answers: Approximately 70
* Bad Answers: Approximately 10
### Key Observations
* **Qwen2.5-0.5B-Instruct** has the highest number of "Bad Answers" and the lowest number of "Good Answers."
* **Mixtral-8x22B-Instruct-v0.1** has the highest number of "Good Answers."
* Some models, like **Llama-3.2-1B-Instruct** and **Qwen2.5-0.5B-Instruct**, have a significantly higher number of "Bad Answers" compared to "Good Answers."
* Other models, like **Llama-3.1-70B-Instruct** and **claude-3-haiku-20240307**, have a higher number of "Good Answers" compared to "Bad Answers."
### Interpretation
The chart provides a comparative analysis of the performance of different language models in terms of generating "Good" versus "Bad" answers. The data suggests that the models vary significantly in their ability to produce desirable outputs.
* Models like **Qwen2.5-0.5B-Instruct** may require further refinement or optimization to improve their performance, as they exhibit a strong tendency to generate "Bad Answers."
* Conversely, models like **Mixtral-8x22B-Instruct-v0.1** and **claude-3-haiku-20240307** appear to be more reliable in generating "Good Answers."
* The differences in performance could be attributed to various factors, including model architecture, training data, and hyperparameter tuning.
* The chart highlights the importance of evaluating and comparing different models to identify those that are best suited for specific tasks or applications.
* The "gpt-4o" models show a relatively balanced performance, with a decent number of "Good Answers" and a manageable number of "Bad Answers."
* The older "Llama-3.2-1B-Instruct" model seems to perform the worst, indicating potential improvements in newer model versions.