TECHNICAL ASSET FINGERPRINT
38aca6f51f7c7b7dfc474c8d
Click to view fullscreen
Press ESC or click to close
FOUND IN PAPERS
EXPERT: gemini-2.5-flash-lite-free VERSION 1
RUNTIME: google-free/gemini-2.5-flash-lite
INTEL_VERIFIED
## Stacked Bar Chart: Distribution of Good and Bad Answers by Model
### Overview
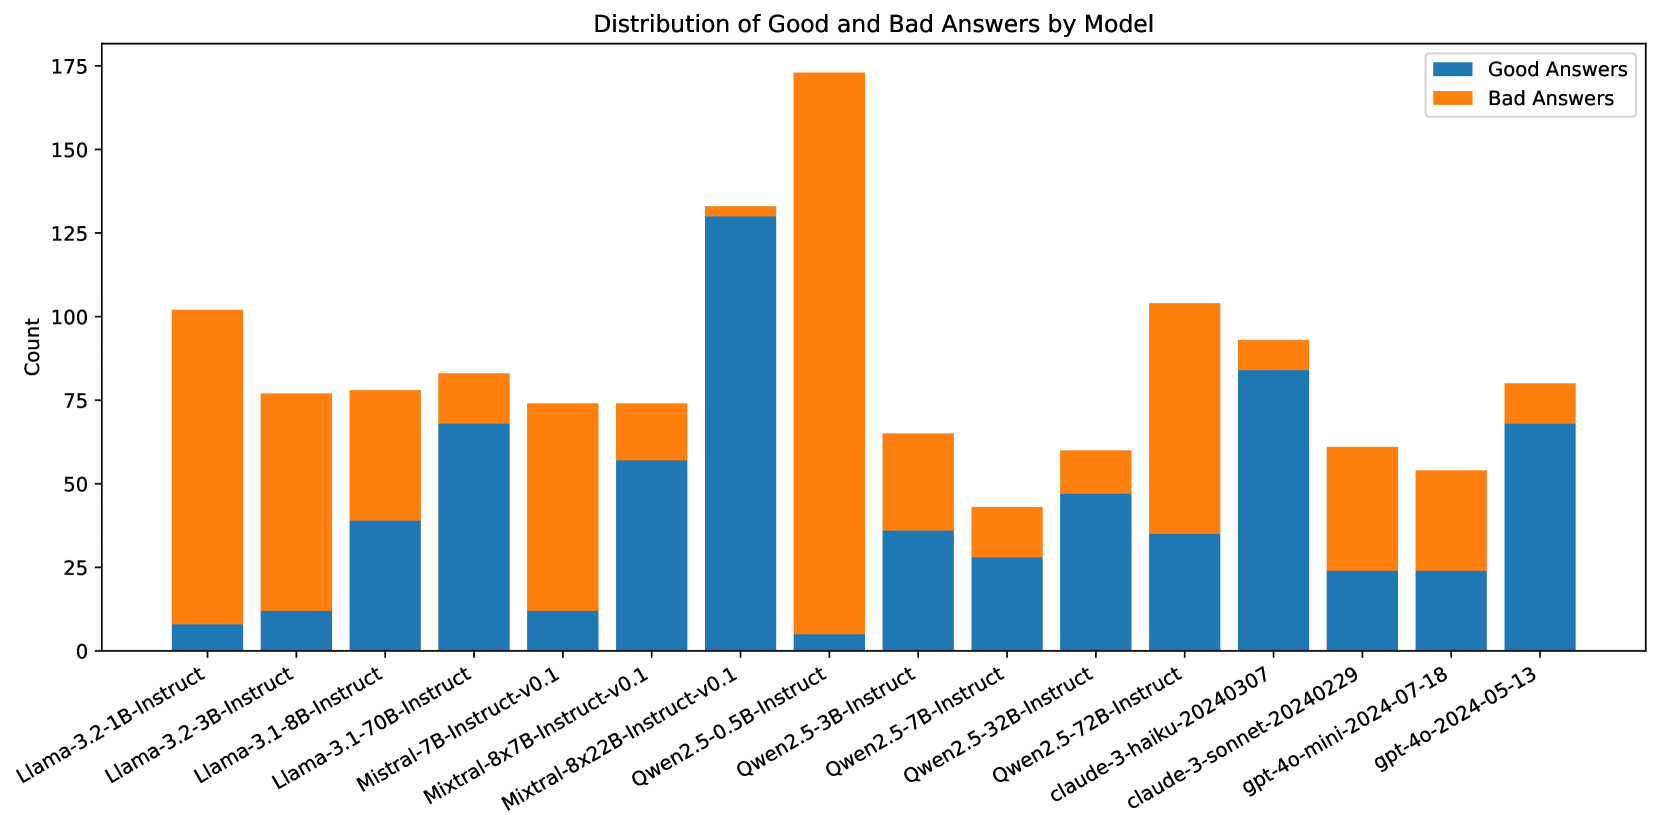
This stacked bar chart displays the distribution of "Good Answers" and "Bad Answers" across various language models. Each bar represents a specific model, and it is segmented into two parts: blue for good answers and orange for bad answers. The height of each segment indicates the count of answers for that category.
### Components/Axes
* **Title:** "Distribution of Good and Bad Answers by Model"
* **Y-axis Title:** "Count"
* **Y-axis Markers:** 0, 25, 50, 75, 100, 125, 150, 175
* **X-axis Labels:** The labels are rotated for readability and represent different language models:
* Llama-3.2-1B-Instruct
* Llama-3.2-3B-Instruct
* Llama-3.1-8B-Instruct
* Llama-3.1-70B-Instruct
* Mistral-7B-Instruct-v0.1
* Mixtral-8x7B-Instruct-v0.1
* Qwen2.5-0.5B-Instruct
* Qwen2.5-3B-Instruct
* Qwen2.5-7B-Instruct
* Qwen2.5-32B-Instruct
* claude-3-haiku-20240307
* claude-3-sonnet-20240229
* gpt-4o-mini-2024-07-18
* gpt-4o-2024-05-13
* **Legend:** Located in the top-right corner of the chart.
* Blue rectangle: "Good Answers"
* Orange rectangle: "Bad Answers"
### Detailed Analysis
The chart presents data for 14 different models. For each model, the count of good and bad answers is stacked.
1. **Llama-3.2-1B-Instruct:**
* Good Answers (Blue): Approximately 10.
* Bad Answers (Orange): Approximately 90.
* Total Count: Approximately 100.
2. **Llama-3.2-3B-Instruct:**
* Good Answers (Blue): Approximately 12.
* Bad Answers (Orange): Approximately 64.
* Total Count: Approximately 76.
3. **Llama-3.1-8B-Instruct:**
* Good Answers (Blue): Approximately 38.
* Bad Answers (Orange): Approximately 38.
* Total Count: Approximately 76.
4. **Llama-3.1-70B-Instruct:**
* Good Answers (Blue): Approximately 70.
* Bad Answers (Orange): Approximately 8.
* Total Count: Approximately 78.
5. **Mistral-7B-Instruct-v0.1:**
* Good Answers (Blue): Approximately 10.
* Bad Answers (Orange): Approximately 65.
* Total Count: Approximately 75.
6. **Mixtral-8x7B-Instruct-v0.1:**
* Good Answers (Blue): Approximately 58.
* Bad Answers (Orange): Approximately 17.
* Total Count: Approximately 75.
7. **Qwen2.5-0.5B-Instruct:**
* Good Answers (Blue): Approximately 32.
* Bad Answers (Orange): Approximately 1.
* Total Count: Approximately 33.
8. **Qwen2.5-3B-Instruct:**
* Good Answers (Blue): Approximately 40.
* Bad Answers (Orange): Approximately 30.
* Total Count: Approximately 70.
9. **Qwen2.5-7B-Instruct:**
* Good Answers (Blue): Approximately 30.
* Bad Answers (Orange): Approximately 15.
* Total Count: Approximately 45.
10. **Qwen2.5-32B-Instruct:**
* Good Answers (Blue): Approximately 48.
* Bad Answers (Orange): Approximately 20.
* Total Count: Approximately 68.
11. **claude-3-haiku-20240307:**
* Good Answers (Blue): Approximately 35.
* Bad Answers (Orange): Approximately 65.
* Total Count: Approximately 100.
12. **claude-3-sonnet-20240229:**
* Good Answers (Blue): Approximately 82.
* Bad Answers (Orange): Approximately 12.
* Total Count: Approximately 94.
13. **gpt-4o-mini-2024-07-18:**
* Good Answers (Blue): Approximately 54.
* Bad Answers (Orange): Approximately 3.
* Total Count: Approximately 57.
14. **gpt-4o-2024-05-13:**
* Good Answers (Blue): Approximately 68.
* Bad Answers (Orange): Approximately 10.
* Total Count: Approximately 78.
### Key Observations
* **Qwen2.5-0.5B-Instruct** has an overwhelmingly high proportion of good answers (approximately 32 good vs. 1 bad).
* **Llama-3.2-1B-Instruct** has an overwhelmingly high proportion of bad answers (approximately 10 good vs. 90 bad).
* **Qwen2.5-3B-Instruct** and **Qwen2.5-7B-Instruct** show a relatively balanced distribution of good and bad answers, with good answers slightly higher in count for Qwen2.5-3B-Instruct.
* **Llama-3.1-70B-Instruct**, **claude-3-sonnet-20240229**, and **gpt-4o-2024-05-13** have a significantly higher count of good answers compared to bad answers.
* **Mixtral-8x7B-Instruct-v0.1** has a substantial number of good answers (approximately 58) but also a notable number of bad answers (approximately 17).
* **claude-3-haiku-20240307** has a higher count of bad answers (approximately 65) than good answers (approximately 35).
* **gpt-4o-mini-2024-07-18** has a very high count of good answers (approximately 54) with a very low count of bad answers (approximately 3).
### Interpretation
This chart visually represents the performance of different language models in terms of generating good versus bad answers. The data suggests significant variability in model performance.
* **Model Specialization/Efficiency:** Models like **Qwen2.5-0.5B-Instruct** and **gpt-4o-mini-2024-07-18** appear to be highly efficient or specialized in producing correct responses, as indicated by their very low bad answer counts. Conversely, **Llama-3.2-1B-Instruct** seems to struggle significantly, with a vast majority of its answers being classified as bad.
* **Performance Tiers:** The models can be broadly categorized into tiers based on their good-to-bad answer ratio. Some models, like **Llama-3.1-70B-Instruct** and **claude-3-sonnet-20240229**, demonstrate a strong tendency towards good answers, suggesting higher overall quality. Others, like **Llama-3.2-1B-Instruct** and **claude-3-haiku-20240307**, exhibit a concerning number of bad answers.
* **Trade-offs:** The data might imply trade-offs between model size, architecture, and performance. For instance, larger models like **Llama-3.1-70B-Instruct** and **claude-3-sonnet-20240229** generally perform better, while smaller models like **Qwen2.5-0.5B-Instruct** can also be highly effective in specific contexts. However, **Llama-3.2-1B-Instruct** is a counterexample, showing poor performance despite its size.
* **Areas for Improvement:** The models with a high proportion of bad answers, such as **Llama-3.2-1B-Instruct** and **claude-3-haiku-20240307**, represent clear areas for further research and development to improve their accuracy and reliability. The models with a more balanced distribution, like **Qwen2.5-3B-Instruct**, might be suitable for applications where a mix of outcomes is acceptable or where further fine-tuning could enhance their good answer rate.
The chart effectively highlights the diverse capabilities and potential weaknesses of these language models, providing valuable insights for selection and development purposes.
DECODING INTELLIGENCE...