## Chart: Performance Comparison of Different Algorithms on Half-Cheetah and Ant Tasks
### Overview
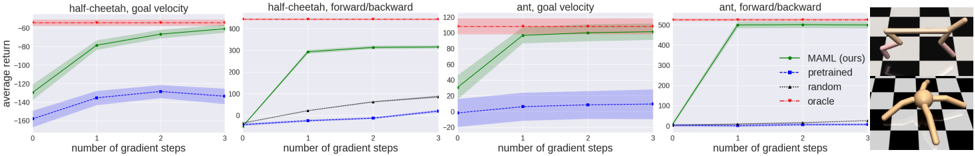
The image presents four line charts comparing the performance of different algorithms (MAML, pretrained, random, and oracle) on two tasks: "half-cheetah" and "ant." For each task, two metrics are evaluated: "goal velocity" and "forward/backward" movement. The x-axis represents the number of gradient steps, and the y-axis represents the average return. A legend on the right side of the charts identifies the color-coded algorithms. The image also includes a visual representation of the "ant" task.
### Components/Axes
* **X-axis:** Number of gradient steps (0, 1, 2, 3)
* **Y-axis:** Average return (varies depending on the chart)
* **Titles:**
* Top-left: "half-cheetah, goal velocity"
* Top-middle-left: "half-cheetah, forward/backward"
* Top-middle-right: "ant, goal velocity"
* Top-right: "ant, forward/backward"
* **Legend (right side of the charts):**
* Green: MAML (ours)
* Blue: pretrained
* Black: random
* Red: oracle
### Detailed Analysis
**1. Half-Cheetah, Goal Velocity**
* **Y-axis:** Average return ranges from -160 to -60.
* **Oracle (Red):** The line is approximately constant at -60.
* **MAML (Green):** The line slopes upward from approximately -130 at 0 steps to approximately -80 at 1 step, then plateaus around -75 at 2 and 3 steps.
* **Pretrained (Blue):** The line slopes upward from approximately -160 at 0 steps to approximately -135 at 1 step, then plateaus around -130 at 2 and 3 steps.
* **Random (Black):** Not present in this chart.
**2. Half-Cheetah, Forward/Backward**
* **Y-axis:** Ranges from 0 to 400.
* **Oracle (Red):** The line is approximately constant at 400.
* **MAML (Green):** The line slopes upward from approximately 0 at 0 steps to approximately 300 at 1 step, then plateaus around 320 at 2 and 3 steps.
* **Pretrained (Blue):** The line slopes upward from approximately 0 at 0 steps to approximately 50 at 3 steps.
* **Random (Black):** The line slopes upward from approximately 0 at 0 steps to approximately 100 at 3 steps.
**3. Ant, Goal Velocity**
* **Y-axis:** Ranges from -20 to 120.
* **Oracle (Red):** The line is approximately constant at 115.
* **MAML (Green):** The line slopes upward from approximately 0 at 0 steps to approximately 95 at 1 step, then plateaus around 100 at 2 and 3 steps.
* **Pretrained (Blue):** The line slopes upward from approximately -20 at 0 steps to approximately 10 at 1 step, then plateaus around 15 at 2 and 3 steps.
* **Random (Black):** Not present in this chart.
**4. Ant, Forward/Backward**
* **Y-axis:** Ranges from 0 to 500.
* **Oracle (Red):** The line is approximately constant at 520.
* **MAML (Green):** The line slopes upward from approximately 0 at 0 steps to approximately 500 at 1 step, then plateaus around 500 at 2 and 3 steps.
* **Pretrained (Blue):** The line is approximately constant at 0.
* **Random (Black):** Not present in this chart.
### Key Observations
* The "oracle" algorithm consistently achieves the highest average return across all tasks and metrics.
* The "MAML" algorithm generally outperforms the "pretrained" and "random" algorithms, especially after a few gradient steps.
* The "pretrained" algorithm shows some improvement over the "random" algorithm in the "half-cheetah" tasks, but its performance is significantly lower than "MAML" and "oracle."
* The performance of all algorithms tends to plateau after 1 or 2 gradient steps.
### Interpretation
The charts demonstrate the effectiveness of the MAML algorithm in adapting to new tasks with a small number of gradient steps. The "oracle" algorithm represents an ideal performance ceiling, while the "pretrained" and "random" algorithms serve as baselines. The results suggest that MAML can quickly learn and achieve near-optimal performance, making it a promising approach for meta-learning and few-shot learning scenarios. The plateauing of performance after a few gradient steps indicates that further optimization may not yield significant improvements.