## Diagram: Monte Carlo Tree Search (MCTS)
### Overview
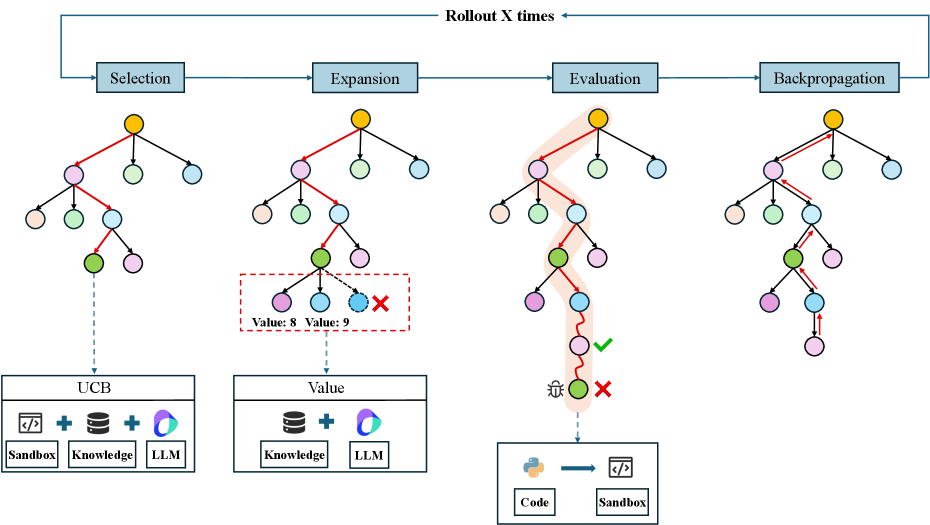
The image illustrates the Monte Carlo Tree Search (MCTS) algorithm, showing the four main stages: Selection, Expansion, Evaluation, and Backpropagation. The diagram depicts a tree structure that is explored and updated during the search process. The process is repeated "Rollout X times".
### Components/Axes
* **Title:** None explicitly given, but the diagram depicts the Monte Carlo Tree Search (MCTS) algorithm.
* **Stages (from left to right):**
* Selection
* Expansion
* Evaluation
* Backpropagation
* **Nodes:** Represented as colored circles. Colors include:
* Yellow (root node)
* Pink
* Green
* Light Blue
* **Edges:** Represented as black lines, with red arrows indicating the path taken during the search.
* **Rollout:** The entire process is repeated "Rollout X times", as indicated by a blue arrow looping from Backpropagation back to Selection.
* **UCB (Selection Stage):**
* Sandbox icon
* Knowledge icon (database)
* LLM icon (purple/blue swirl)
* **Value (Expansion Stage):**
* Knowledge icon (database)
* LLM icon (purple/blue swirl)
* **Evaluation Stage:**
* Python icon
* Arrow pointing to Sandbox icon
* **Value Indicators (Expansion Stage):**
* "Value: 8"
* "Value: 9"
* **Evaluation Indicators (Evaluation Stage):**
* Bug icon
* Green checkmark
* Red X
### Detailed Analysis
**1. Selection:**
* Starts at the yellow root node.
* A red arrow indicates the path taken down the tree.
* The path goes from the yellow node to a pink node, then to a green node.
* A dashed blue arrow points from the green node to a box labeled "UCB".
* The "UCB" box contains icons for "Sandbox", "Knowledge", and "LLM", connected by plus signs.
**2. Expansion:**
* Starts at the yellow root node.
* A red arrow indicates the path taken down the tree.
* The path goes from the yellow node to a pink node, then to a green node.
* From the green node, there are two possible expansions:
* A pink node with "Value: 8"
* A light blue node with "Value: 9" and a red "X" indicating a failed expansion.
* A dashed blue arrow points from the green node to a box labeled "Value".
* The "Value" box contains icons for "Knowledge" and "LLM", connected by a plus sign.
**3. Evaluation:**
* Starts at the yellow root node.
* A red arrow indicates the path taken down the tree. The path is highlighted with a light red background.
* The path goes from the yellow node to a pink node, then to a green node, then to a pink node.
* The path continues down to a light blue node, where a bug icon is present.
* The path ends at a green node with a green checkmark and a pink node with a red "X".
* A dashed blue arrow points from the pink node with the red "X" to a box containing a Python icon, an arrow, and a "Sandbox" icon. The box is labeled "Code" and "Sandbox" respectively.
**4. Backpropagation:**
* Starts at the yellow root node.
* Red arrows indicate the path taken back up the tree.
* The path goes from a pink node to a light blue node, then to a green node, then to a pink node, and finally to the yellow node.
### Key Observations
* The diagram illustrates the iterative nature of MCTS, with the "Rollout X times" loop.
* Each stage of MCTS is clearly represented with its corresponding actions and data.
* The diagram highlights the use of UCB for node selection and value estimation for node expansion.
* The evaluation stage shows the interaction between code execution (Python) and a sandbox environment.
* The backpropagation stage shows how the results of the evaluation are propagated back up the tree.
### Interpretation
The diagram provides a visual representation of the MCTS algorithm, which is commonly used in decision-making problems, particularly in game playing and reinforcement learning. The diagram shows how the algorithm explores the search space by iteratively selecting, expanding, evaluating, and backpropagating information through a tree structure. The use of UCB in the selection stage helps to balance exploration and exploitation, while the value estimation in the expansion stage provides a way to prioritize promising nodes. The evaluation stage simulates the outcome of actions, and the backpropagation stage updates the values of the nodes in the tree based on the simulation results. The "Rollout X times" loop indicates that the algorithm repeats these steps multiple times to refine its search and improve its decision-making. The diagram also highlights the use of a sandbox environment for code execution during the evaluation stage, which is important for security and isolation.