## Dual-Axis Line Chart: Token Length and Pass Rate vs. RL Training Steps
### Overview
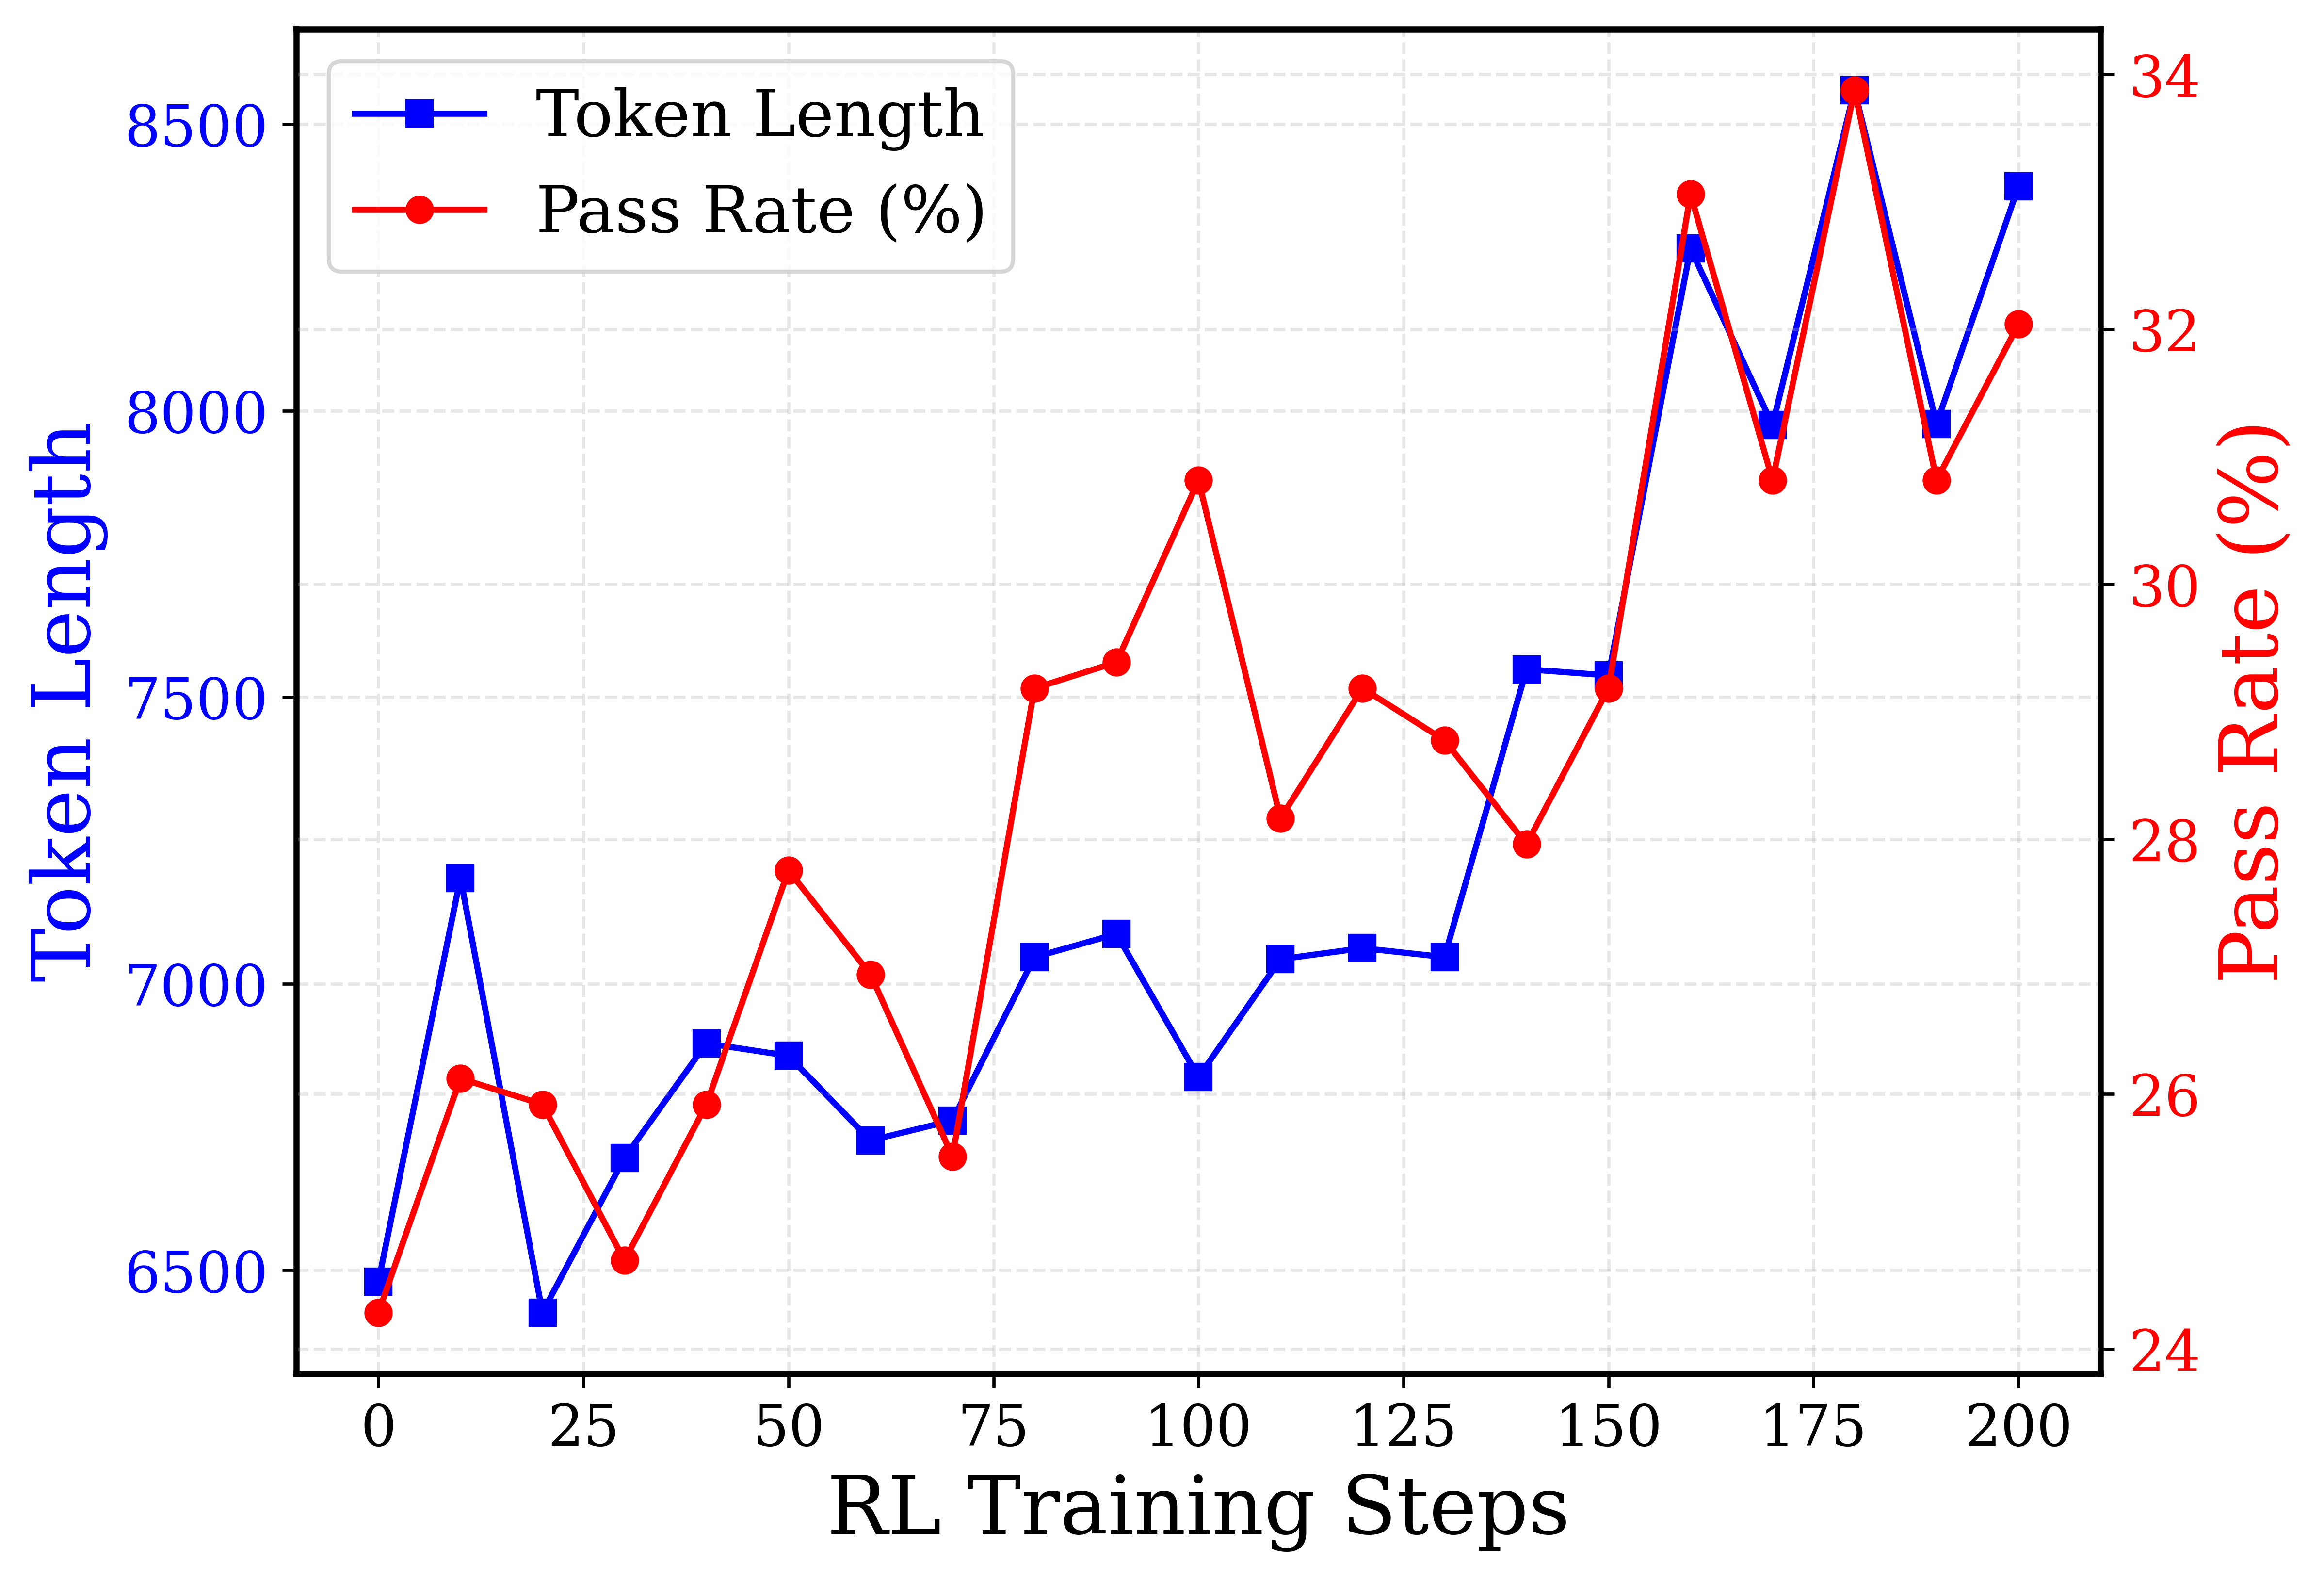
This image is a dual-axis line chart tracking two distinct metrics—"Token Length" and "Pass Rate (%)"—over a series of "RL Training Steps." The chart demonstrates how these two variables evolve simultaneously during a machine learning training process, specifically Reinforcement Learning (RL).
### Components/Axes
**Spatial Layout & Component Isolation:**
* **Header/Top-Left:** A legend is positioned in the top-left corner, enclosed in a rounded rectangular box with a light gray border.
* *Legend Item 1:* A solid blue line with a square marker, labeled "Token Length" in black text.
* *Legend Item 2:* A solid red line with a circular marker, labeled "Pass Rate (%)" in black text.
* **Bottom (X-Axis):** Positioned horizontally across the bottom.
* *Label:* "RL Training Steps" (Black text, centered).
* *Scale/Markers:* 0, 25, 50, 75, 100, 125, 150, 175, 200. (Linear scale, increments of 25).
* **Left (Y-Axis 1):** Positioned vertically on the left edge.
* *Label:* "Token Length" (Blue text, rotated 90 degrees counter-clockwise).
* *Scale/Markers:* 6500, 7000, 7500, 8000, 8500. (Linear scale, increments of 500, blue text).
* **Right (Y-Axis 2):** Positioned vertically on the right edge.
* *Label:* "Pass Rate (%)" (Red text, rotated 90 degrees clockwise).
* *Scale/Markers:* 24, 26, 28, 30, 32, 34. (Linear scale, increments of 2, red text).
* **Main Chart Area:** Contains a light gray, dashed grid aligning with the major tick marks of all three axes. Two data series are plotted across this grid.
### Detailed Analysis
*Note: All numerical values extracted below are approximate (`~`), derived visually by aligning the data points with the respective axis grids.*
**Trend Verification 1: Token Length (Blue Line, Square Markers)**
*Visual Trend:* The blue line exhibits high volatility early on, with a sharp spike at step 10 followed by a drop. From step 30 to 130, it remains relatively flat within the 6700-7100 range. After step 130, it experiences a massive, volatile upward trend, peaking at step 180 before ending high at step 200.
**Trend Verification 2: Pass Rate (%) (Red Line, Circular Markers)**
*Visual Trend:* The red line starts at its lowest point and generally trends upward over time, though with significant jaggedness. It experiences a notable mid-training peak at step 100, dips, and then mirrors the extreme volatility and upward trajectory of the blue line from step 140 onwards, also peaking at step 180.
**Reconstructed Data Table:**
*Cross-referencing the legend: Blue squares are read against the Left Axis (6500-8500). Red circles are read against the Right Axis (24-34).*
| RL Training Steps (X-Axis) | Token Length (Blue/Left Axis) | Pass Rate (%) (Red/Right Axis) |
| :--- | :--- | :--- |
| 0 | ~6480 | ~24.2 |
| 10 | ~7180 | ~26.1 |
| 20 | ~6420 | ~25.9 |
| 30 | ~6690 | ~24.6 |
| 40 | ~6890 | ~25.9 |
| 50 | ~6870 | ~27.8 |
| 60 | ~6720 | ~27.0 |
| 70 | ~6760 | ~25.5 |
| 80 | ~7050 | ~29.3 |
| 90 | ~7080 | ~29.5 |
| 100 | ~6830 | ~31.0 |
| 110 | ~7040 | ~28.2 |
| 120 | ~7060 | ~29.3 |
| 130 | ~7050 | ~28.9 |
| 140 | ~7550 | ~28.0 |
| 150 | ~7540 | ~29.3 |
| 160 | ~8280 | ~33.2 |
| 170 | ~7980 | ~30.9 |
| 180 | ~8560 | ~34.1 |
| 190 | ~7980 | ~30.9 |
| 200 | ~8390 | ~32.2 |
### Key Observations
1. **Overall Upward Trajectory:** Both metrics end significantly higher at step 200 than they began at step 0. Token length increases from roughly 6480 to 8390, while Pass Rate increases from roughly 24.2% to 32.2%.
2. **Late-Stage Correlation:** From step 150 to 200, the two lines exhibit near-identical geometric shapes. When Token Length spikes (steps 160, 180, 200), Pass Rate also spikes. When Token Length drops (steps 170, 190), Pass Rate drops.
3. **Mid-Stage Divergence:** Between steps 80 and 110, the metrics diverge slightly. Pass Rate climbs to a local peak of ~31.0% at step 100, while Token Length actually dips to ~6830 at the exact same step.
4. **Extreme Volatility:** The training process is not smooth. The period between steps 150 and 200 shows massive swings in both metrics between consecutive 10-step intervals.
### Interpretation
This chart provides a fascinating look into the behavior of a Large Language Model (LLM) undergoing Reinforcement Learning (likely RLHF - Reinforcement Learning from Human Feedback, or similar).
**Reading Between the Lines (Peircean Analysis):**
The data strongly suggests a direct, causal relationship between the length of the model's output ("Token Length") and its success in solving a prompt ("Pass Rate"). Because the Pass Rate improves as the Token Length increases, it is highly probable that the model is being trained on complex reasoning tasks (such as mathematics, logic puzzles, or coding). In these domains, models that utilize "Chain of Thought" reasoning—generating step-by-step explanations before arriving at an answer—naturally produce much longer token outputs.
The RL algorithm appears to be rewarding the model for getting the correct answer (Pass Rate). In its attempt to maximize this reward, the model "discovers" that generating longer, more detailed reasoning paths leads to higher success. This is evidenced by the late-stage correlation (steps 150-200), where the model's policy shifts dramatically toward generating very long responses (~8000+ tokens), which directly yields the highest pass rates (~33-34%).
The extreme volatility in the later steps indicates that the RL training might be using a high learning rate, or the policy is exploring aggressively. The model hasn't fully converged into a stable state; it is wildly oscillating between generating very long, successful outputs and shorter, less successful ones. The divergence at step 100 (high pass rate, lower token length) might represent a brief period where the model found an efficient shortcut to solve certain problems, but this strategy was ultimately abandoned in favor of the "longer is better" approach seen at the end of the graph.