## Box Plot: Statistical Parity (DSP) vs. Different Fairness Scenarios
### Overview
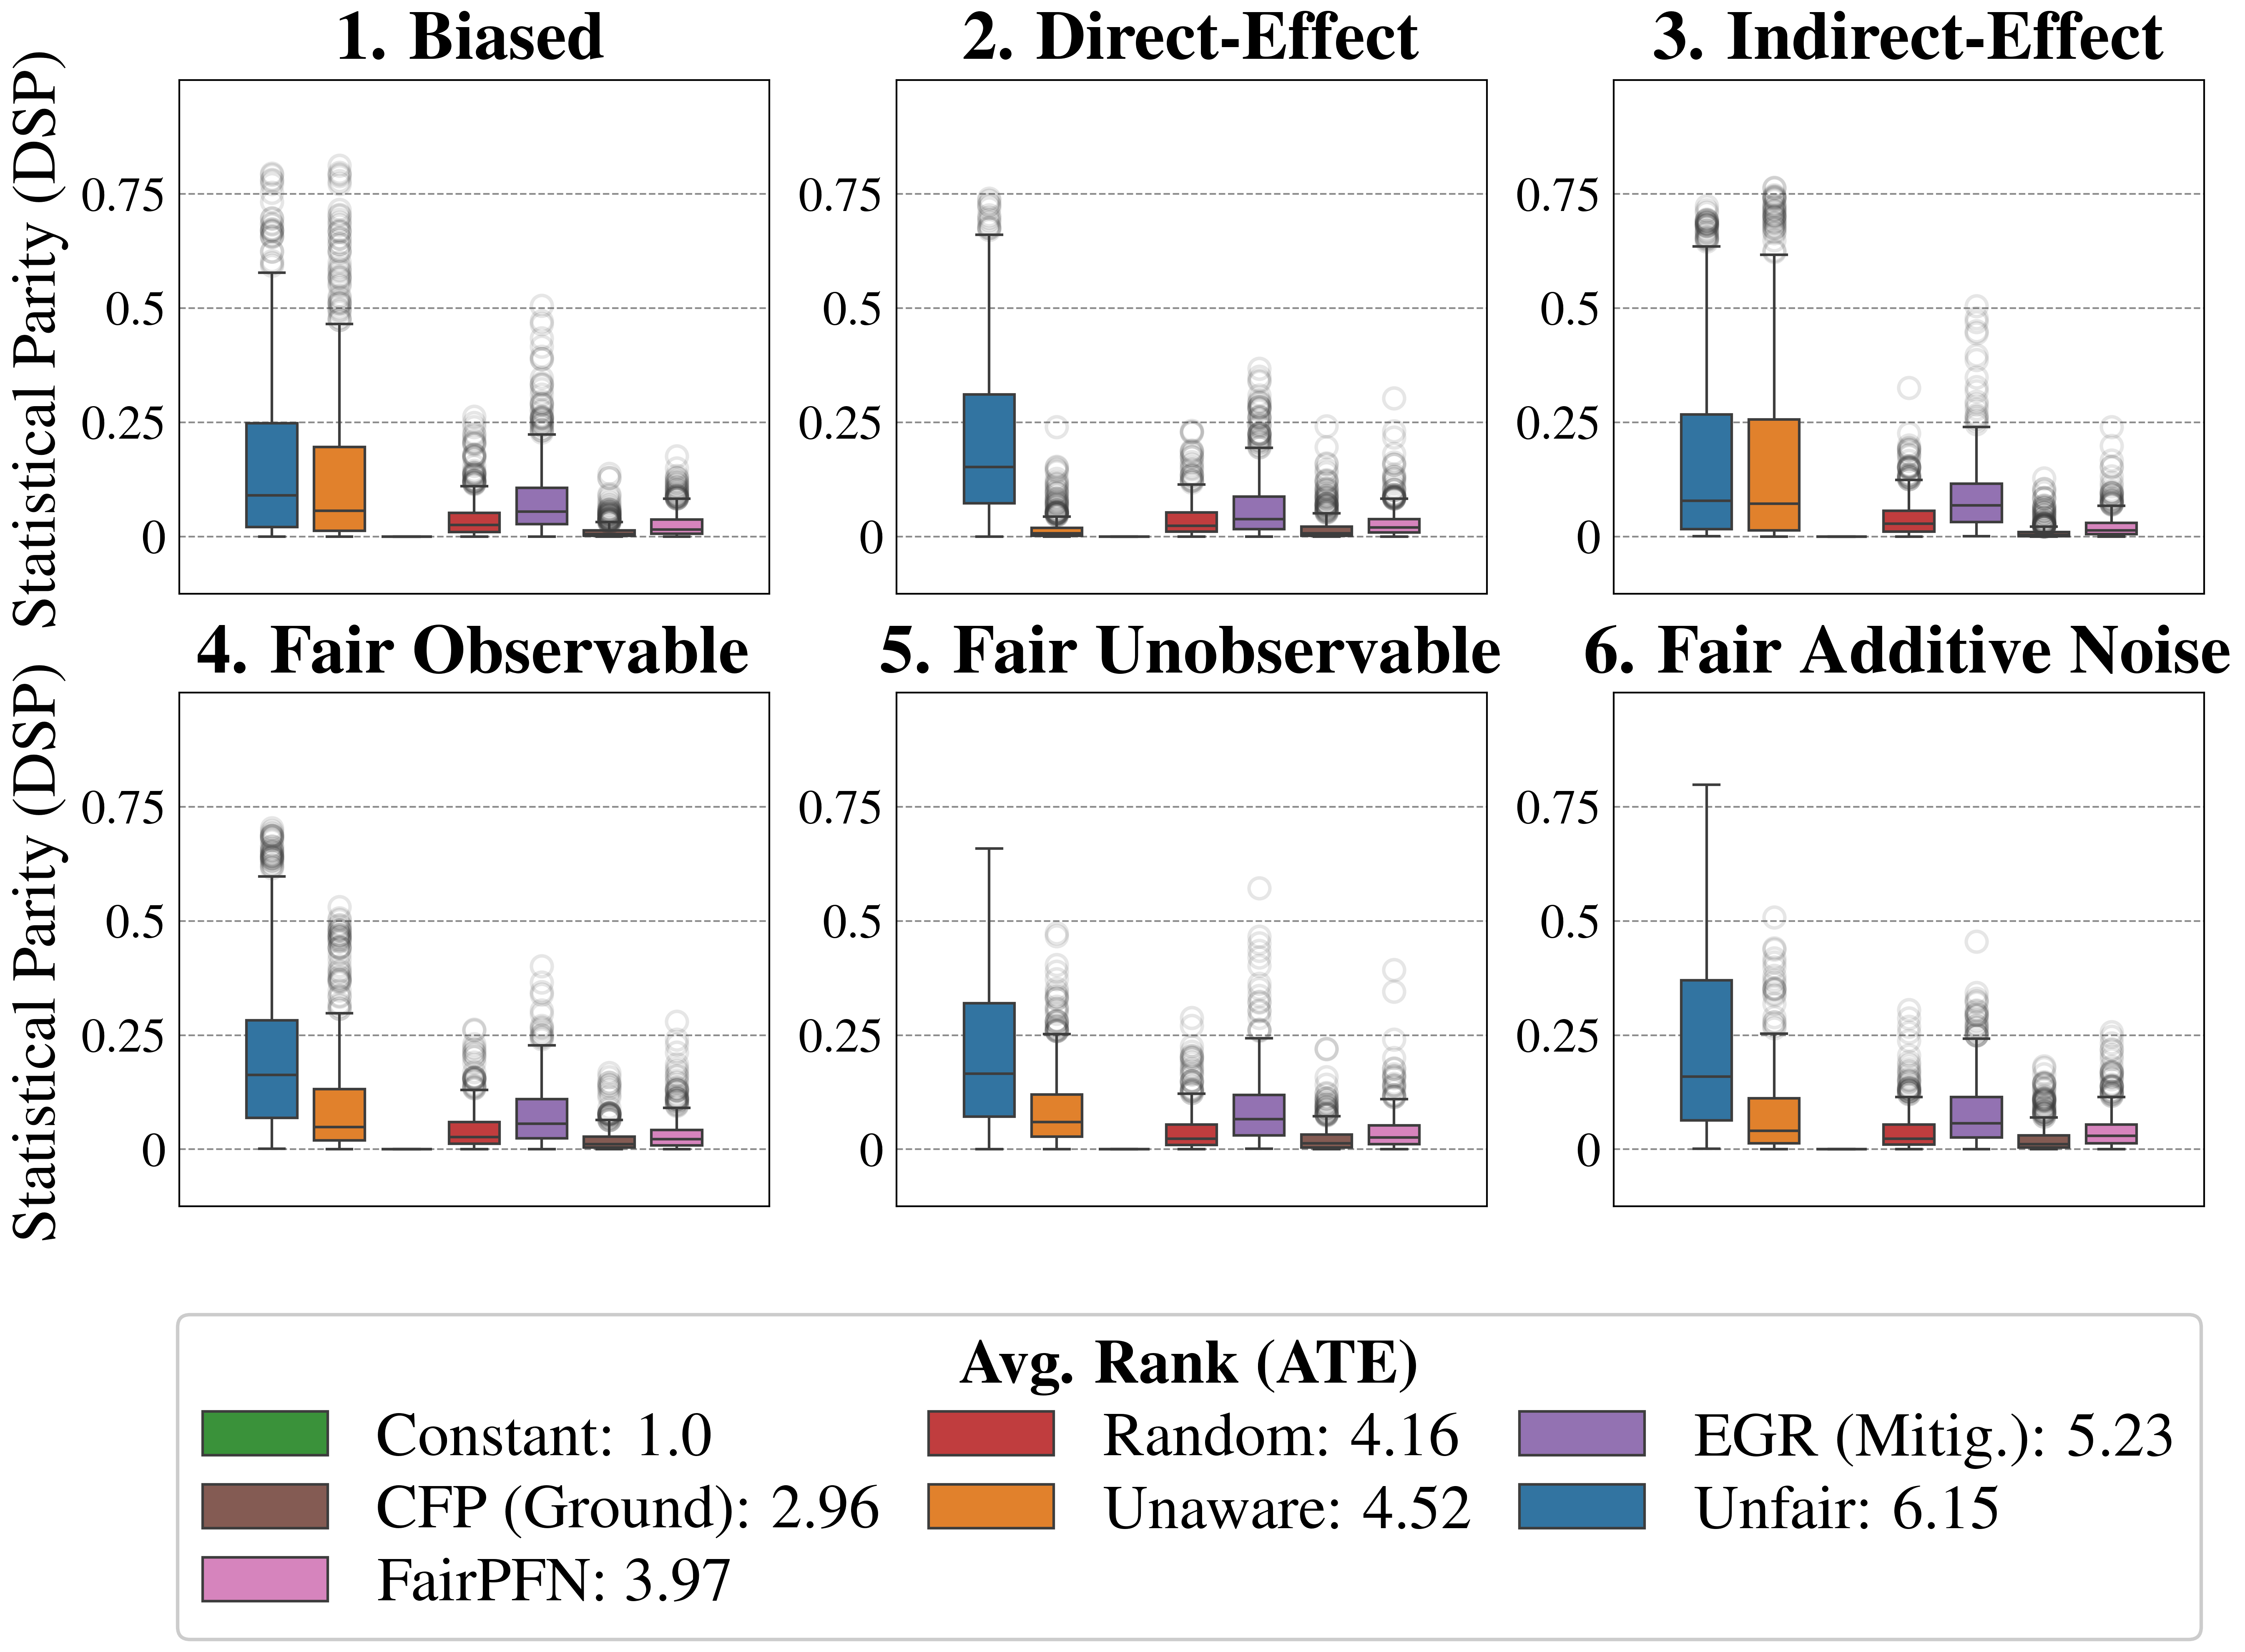
The image contains six box plots arranged in a 2x3 grid. Each box plot visualizes the statistical parity (DSP) under different fairness scenarios: Biased, Direct-Effect, Indirect-Effect, Fair Observable, Fair Unobservable, and Fair Additive Noise. The x-axis represents different methods, and the y-axis represents the Statistical Parity (DSP). A legend at the bottom describes the methods and their average rank (ATE).
### Components/Axes
* **Title:** The overall title is implied from the y-axis label: Statistical Parity (DSP).
* **X-axis:** The x-axis is categorical, representing different methods. The specific methods are detailed in the legend.
* **Y-axis:** Statistical Parity (DSP). The y-axis ranges from 0 to 0.75, with tick marks at 0, 0.25, 0.5, and 0.75. Horizontal dashed lines are present at these intervals.
* **Box Plots:** Each box plot represents the distribution of Statistical Parity for a given method under a specific fairness scenario.
* **Outliers:** Outliers are represented as circles above the box plots.
* **Titles for each subplot**:
1. Biased
2. Direct-Effect
3. Indirect-Effect
4. Fair Observable
5. Fair Unobservable
6. Fair Additive Noise
* **Legend (located at the bottom):**
* Green: Constant: 1.0
* Brown: CFP (Ground): 2.96
* Pink: FairPFN: 3.97
* Red: Random: 4.16
* Orange: Unaware: 4.52
* Purple: EGR (Mitig.): 5.23
* Blue: Unfair: 6.15
### Detailed Analysis
Each subplot contains boxplots for the following methods: Unfair (blue), Unaware (orange), Constant (green), Random (red), EGR (Mitig.) (purple), CFP (Ground) (brown), and FairPFN (pink).
**1. Biased**
* Unfair: Median around 0.125-0.25, with outliers extending to 0.75.
* Unaware: Median around 0.0-0.125, with outliers extending to 0.75.
* Constant: Median at 0.0.
* Random: Median around 0.0-0.125, with outliers extending to 0.25.
* EGR (Mitig.): Median around 0.0-0.125, with outliers extending to 0.25.
* CFP (Ground): Median around 0.0.
* FairPFN: Median around 0.0.
**2. Direct-Effect**
* Unfair: Median around 0.125-0.25, with outliers extending to 0.75.
* Unaware: Median around 0.0, with outliers extending to 0.125.
* Constant: Median at 0.0.
* Random: Median around 0.0, with outliers extending to 0.125.
* EGR (Mitig.): Median around 0.0, with outliers extending to 0.25.
* CFP (Ground): Median around 0.0.
* FairPFN: Median around 0.0.
**3. Indirect-Effect**
* Unfair: Median around 0.125-0.25, with outliers extending to 0.75.
* Unaware: Median around 0.125-0.25, with outliers extending to 0.75.
* Constant: Median at 0.0.
* Random: Median around 0.0, with outliers extending to 0.25.
* EGR (Mitig.): Median around 0.0-0.125, with outliers extending to 0.5.
* CFP (Ground): Median around 0.0.
* FairPFN: Median around 0.0.
**4. Fair Observable**
* Unfair: Median around 0.125-0.25, with outliers extending to 0.75.
* Unaware: Median around 0.0-0.125, with outliers extending to 0.5.
* Constant: Median at 0.0.
* Random: Median around 0.0, with outliers extending to 0.25.
* EGR (Mitig.): Median around 0.0-0.125, with outliers extending to 0.25.
* CFP (Ground): Median around 0.0.
* FairPFN: Median around 0.0.
**5. Fair Unobservable**
* Unfair: Median around 0.125-0.25, with outliers extending to 0.75.
* Unaware: Median around 0.0-0.125, with outliers extending to 0.5.
* Constant: Median at 0.0.
* Random: Median around 0.0, with outliers extending to 0.125.
* EGR (Mitig.): Median around 0.0-0.125, with outliers extending to 0.25.
* CFP (Ground): Median around 0.0.
* FairPFN: Median around 0.0.
**6. Fair Additive Noise**
* Unfair: Median around 0.125-0.25, with outliers extending to 0.75.
* Unaware: Median around 0.0-0.125, with outliers extending to 0.5.
* Constant: Median at 0.0.
* Random: Median around 0.0, with outliers extending to 0.25.
* EGR (Mitig.): Median around 0.0-0.125, with outliers extending to 0.25.
* CFP (Ground): Median around 0.0.
* FairPFN: Median around 0.0.
### Key Observations
* The "Unfair" method (blue) consistently shows higher statistical parity (DSP) across all scenarios, with medians generally between 0.125 and 0.25 and significant outliers.
* The "Unaware" method (orange) also shows relatively higher statistical parity compared to "Constant", "Random", "EGR (Mitig.)", "CFP (Ground)", and "FairPFN", but generally lower than "Unfair".
* The "Constant" (green), "CFP (Ground)" (brown), and "FairPFN" (pink) methods consistently show very low statistical parity, with medians close to 0.
* The "Random" (red) and "EGR (Mitig.)" (purple) methods show low statistical parity, with medians close to 0, but with some outliers.
* The presence of outliers suggests variability in the statistical parity for some methods, depending on the specific data sample.
### Interpretation
The box plots illustrate the impact of different fairness scenarios on the statistical parity (DSP) achieved by various methods. The "Unfair" method, as expected, exhibits the highest statistical parity, indicating a potential bias. The "Unaware" method also shows relatively high statistical parity, suggesting that simply being unaware of protected attributes is not sufficient to guarantee fairness. The "Constant", "CFP (Ground)", and "FairPFN" methods consistently achieve low statistical parity, indicating they are more effective in mitigating bias under these scenarios. The "Random" and "EGR (Mitig.)" methods show some variability, suggesting their effectiveness may depend on the specific data distribution. The average rank (ATE) values in the legend provide additional context, indicating the relative performance of each method across different fairness metrics. The data suggests that careful selection of fairness-aware methods is crucial to minimize statistical parity differences and achieve fairer outcomes.