\n
## Box Plot Comparison: Statistical Parity (DSP) under Different Fairness Interventions
### Overview
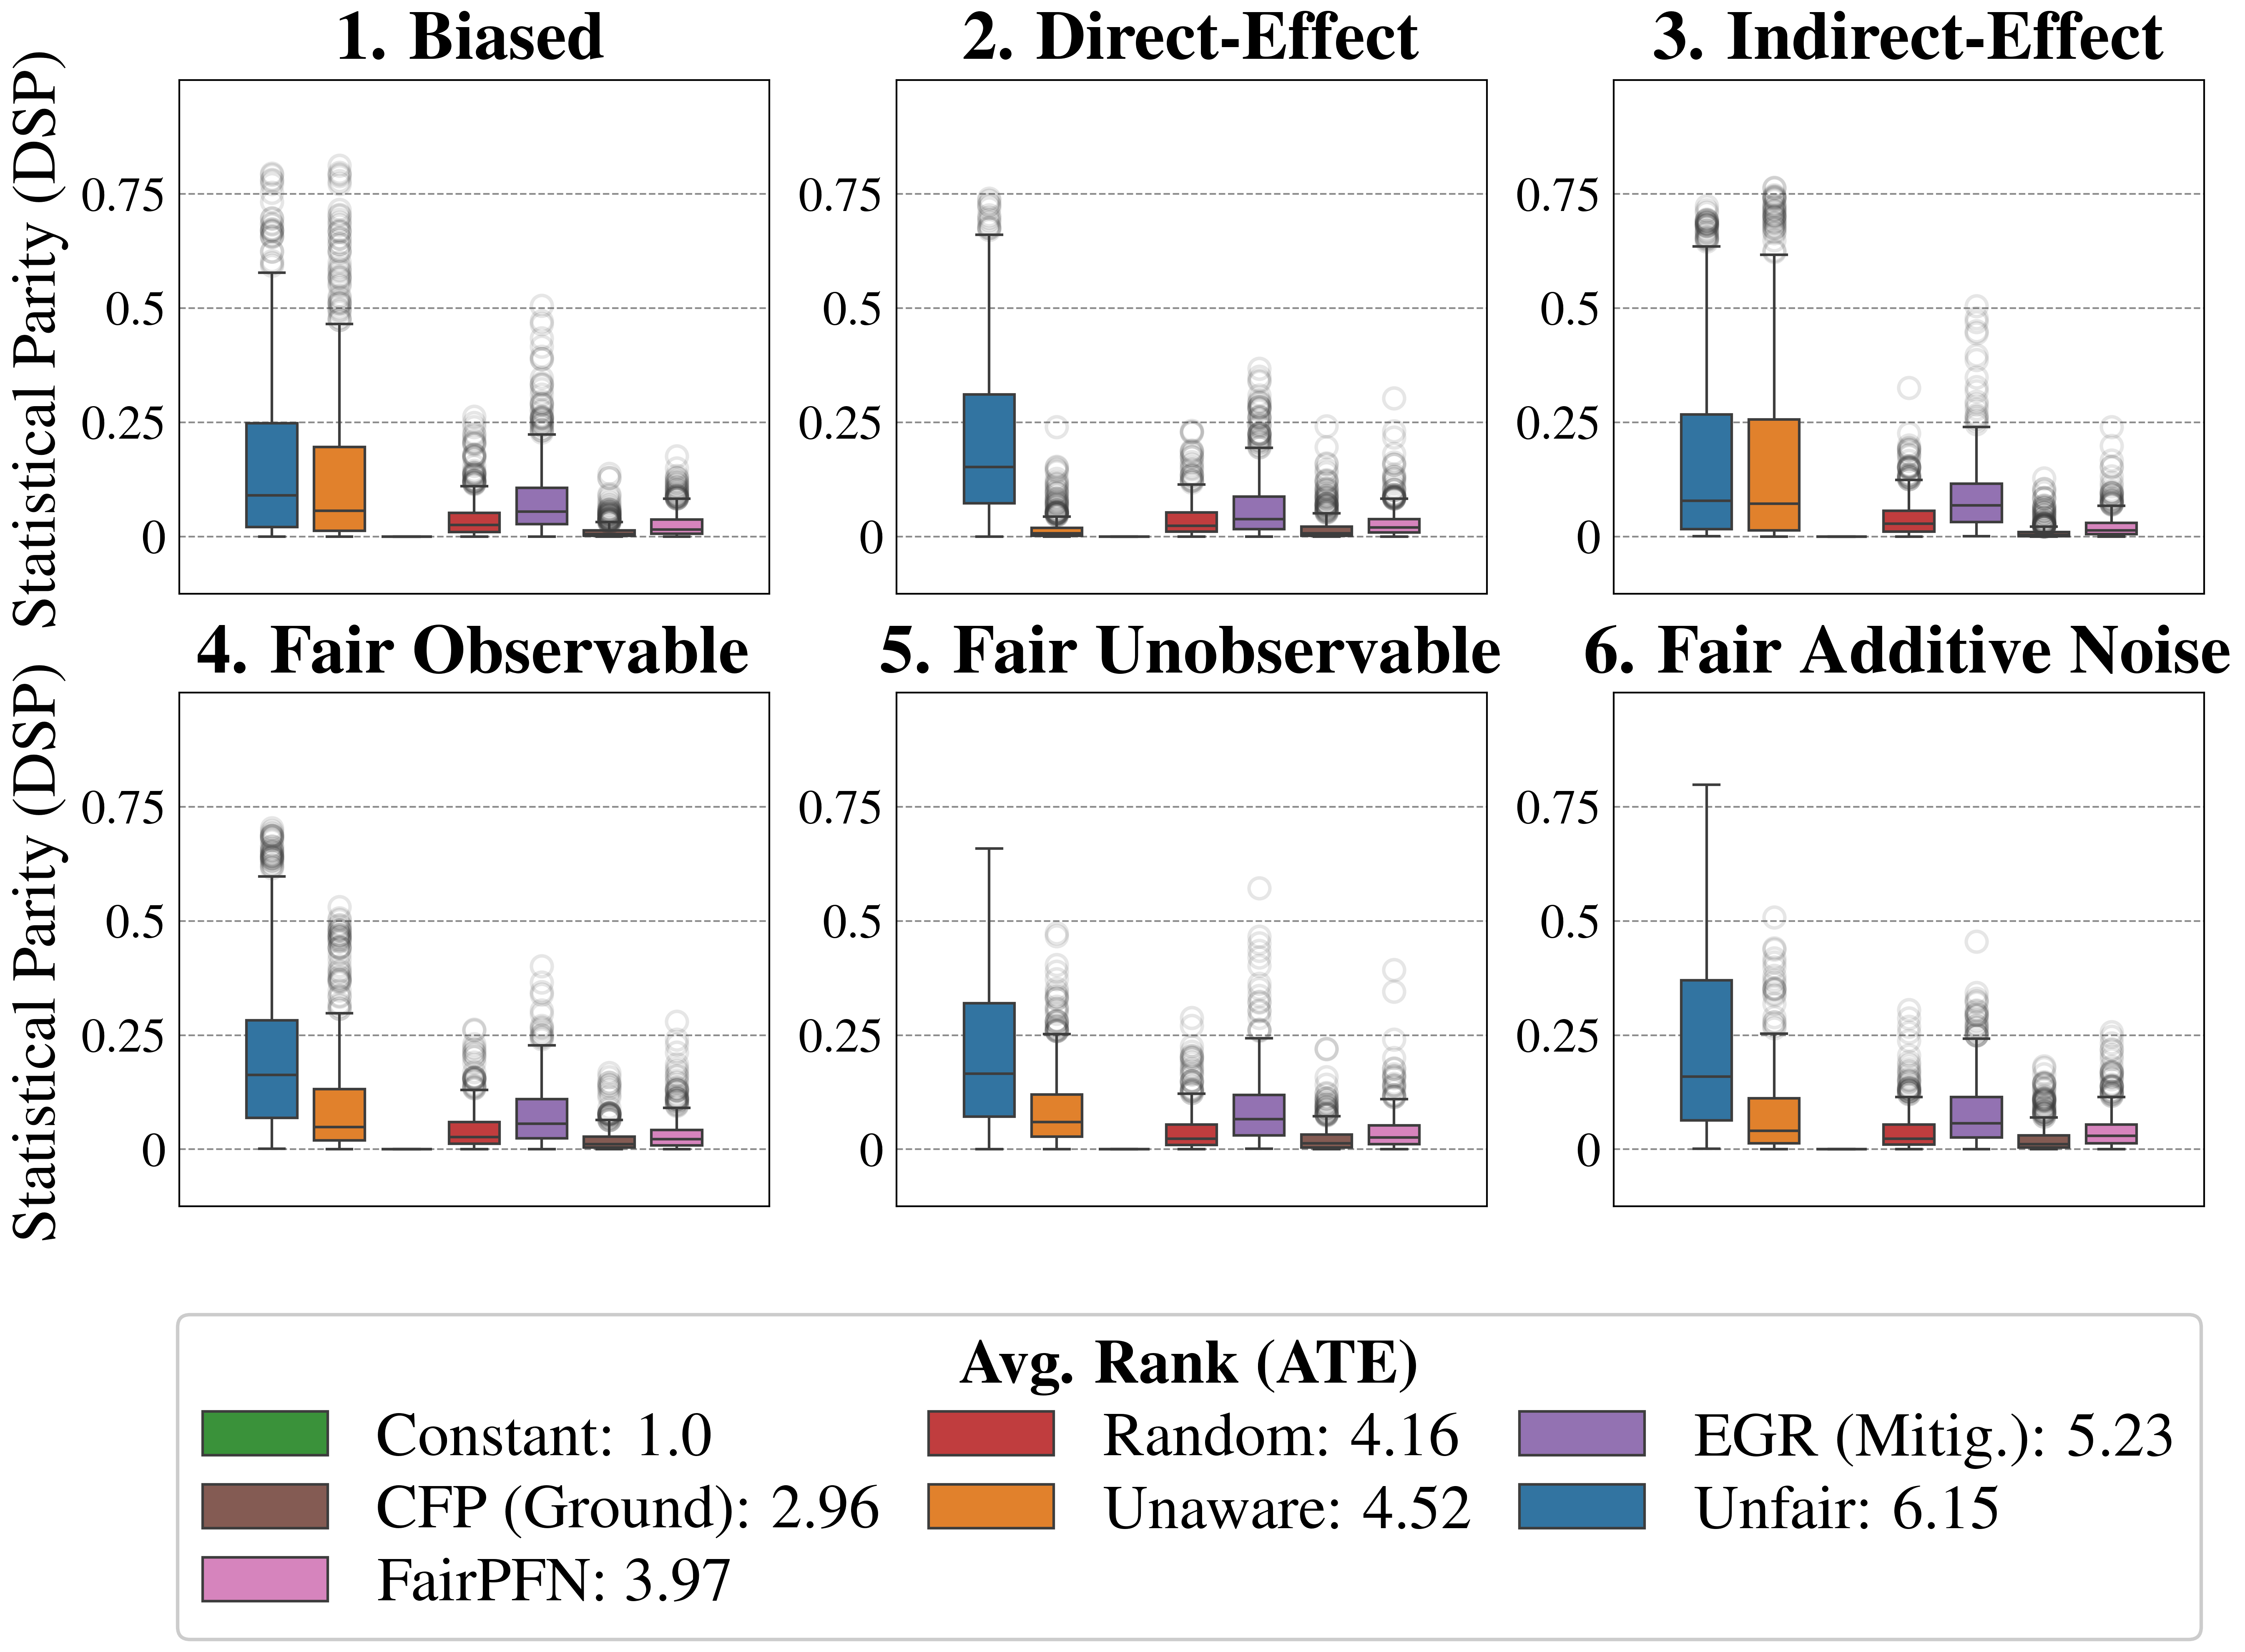
The image presents a 3x2 grid of box plots, each representing the distribution of Statistical Parity (DSP) scores under different fairness intervention scenarios. The plots compare the performance of several algorithms: Constant, CFP (Ground), FairPFN, EGR (Mitig.), Unaware, and Random. Each box plot displays the distribution of DSP values, with the y-axis representing the DSP score ranging from 0 to 0.75. The x-axis is implicit, representing the different algorithms being compared within each scenario.
### Components/Axes
* **Y-axis:** Statistical Parity (DSP) - Scale ranges from 0 to 0.75.
* **X-axis:** Implicitly represents the different algorithms being compared within each scenario.
* **Titles:** Each subplot is labeled with a fairness scenario: 1. Biased, 2. Direct-Effect, 3. Indirect-Effect, 4. Fair Observable, 5. Fair Unobservable, 6. Fair Additive Noise.
* **Legend:** Located at the bottom of the image, it maps colors to algorithms:
* Green: Constant (1.0)
* Brown: CFP (Ground) (2.96)
* Purple: FairPFN (3.97)
* Red: EGR (Mitig.) (5.23)
* Light Blue: Unaware (4.52)
* Gray: Random (4.16)
* **Avg. Rank (ATE):** A small text block in the bottom-center provides the average rank of each algorithm based on Average Treatment Effect (ATE).
### Detailed Analysis or Content Details
Each subplot shows a box plot for each algorithm. I will describe the trends and approximate values for each scenario.
**1. Biased:**
* Constant: Median around 0.25, interquartile range (IQR) approximately 0.15-0.4.
* CFP (Ground): Median around 0.2, IQR approximately 0.1-0.3.
* FairPFN: Median around 0.3, IQR approximately 0.2-0.45.
* EGR (Mitig.): Median around 0.6, IQR approximately 0.5-0.7.
* Unaware: Median around 0.3, IQR approximately 0.2-0.5.
* Random: Median around 0.25, IQR approximately 0.15-0.4.
**2. Direct-Effect:**
* Constant: Median around 0.1, IQR approximately 0.05-0.2.
* CFP (Ground): Median around 0.15, IQR approximately 0.1-0.25.
* FairPFN: Median around 0.25, IQR approximately 0.15-0.4.
* EGR (Mitig.): Median around 0.6, IQR approximately 0.5-0.7.
* Unaware: Median around 0.2, IQR approximately 0.1-0.3.
* Random: Median around 0.15, IQR approximately 0.1-0.3.
**3. Indirect-Effect:**
* Constant: Median around 0.1, IQR approximately 0.05-0.2.
* CFP (Ground): Median around 0.2, IQR approximately 0.1-0.3.
* FairPFN: Median around 0.3, IQR approximately 0.2-0.45.
* EGR (Mitig.): Median around 0.6, IQR approximately 0.5-0.7.
* Unaware: Median around 0.25, IQR approximately 0.15-0.4.
* Random: Median around 0.2, IQR approximately 0.1-0.3.
**4. Fair Observable:**
* Constant: Median around 0.1, IQR approximately 0.05-0.2.
* CFP (Ground): Median around 0.2, IQR approximately 0.1-0.3.
* FairPFN: Median around 0.3, IQR approximately 0.2-0.45.
* EGR (Mitig.): Median around 0.55, IQR approximately 0.45-0.65.
* Unaware: Median around 0.25, IQR approximately 0.15-0.4.
* Random: Median around 0.2, IQR approximately 0.1-0.3.
**5. Fair Unobservable:**
* Constant: Median around 0.1, IQR approximately 0.05-0.2.
* CFP (Ground): Median around 0.15, IQR approximately 0.1-0.25.
* FairPFN: Median around 0.25, IQR approximately 0.15-0.4.
* EGR (Mitig.): Median around 0.55, IQR approximately 0.45-0.65.
* Unaware: Median around 0.2, IQR approximately 0.1-0.3.
* Random: Median around 0.15, IQR approximately 0.1-0.3.
**6. Fair Additive Noise:**
* Constant: Median around 0.1, IQR approximately 0.05-0.2.
* CFP (Ground): Median around 0.2, IQR approximately 0.1-0.3.
* FairPFN: Median around 0.3, IQR approximately 0.2-0.45.
* EGR (Mitig.): Median around 0.6, IQR approximately 0.5-0.7.
* Unaware: Median around 0.25, IQR approximately 0.15-0.4.
* Random: Median around 0.2, IQR approximately 0.1-0.3.
### Key Observations
* EGR (Mitig.) consistently achieves the highest DSP scores across all scenarios, indicating the best fairness performance.
* Constant consistently has the lowest DSP scores.
* CFP (Ground), FairPFN, Unaware, and Random generally have similar DSP scores, falling between Constant and EGR (Mitig.).
* The average rank (ATE) confirms EGR (Mitig.) as the best performing algorithm (5.23), followed by Unaware (4.52), Random (4.16), FairPFN (3.97), CFP (Ground) (2.96), and Constant (1.0).
### Interpretation
The data demonstrates the effectiveness of the EGR (Mitigation) algorithm in achieving statistical parity across various fairness intervention scenarios. The consistently high DSP scores and favorable average rank suggest that EGR effectively reduces bias in the model's predictions. The Constant algorithm, unsurprisingly, performs poorly, indicating that simply ignoring fairness considerations leads to significant disparities. The other algorithms (CFP, FairPFN, Unaware, and Random) offer varying degrees of improvement over the Constant baseline, but none consistently match the performance of EGR.
The differences in DSP scores across the different fairness scenarios highlight the challenges of achieving fairness in complex systems. The "Biased," "Direct-Effect," and "Indirect-Effect" scenarios represent different sources of bias, and the algorithms' performance varies accordingly. The "Fair Observable," "Fair Unobservable," and "Fair Additive Noise" scenarios represent different approaches to mitigating bias, and the data suggests that EGR is robust to these different approaches.
The box plots reveal the variability in DSP scores for each algorithm, indicating that the fairness performance can vary depending on the specific dataset and model configuration. This underscores the importance of carefully evaluating fairness metrics and considering the potential trade-offs between fairness and accuracy.