## Line Graph: Trailing LM Loss vs. PFLOP/s-days
### Overview
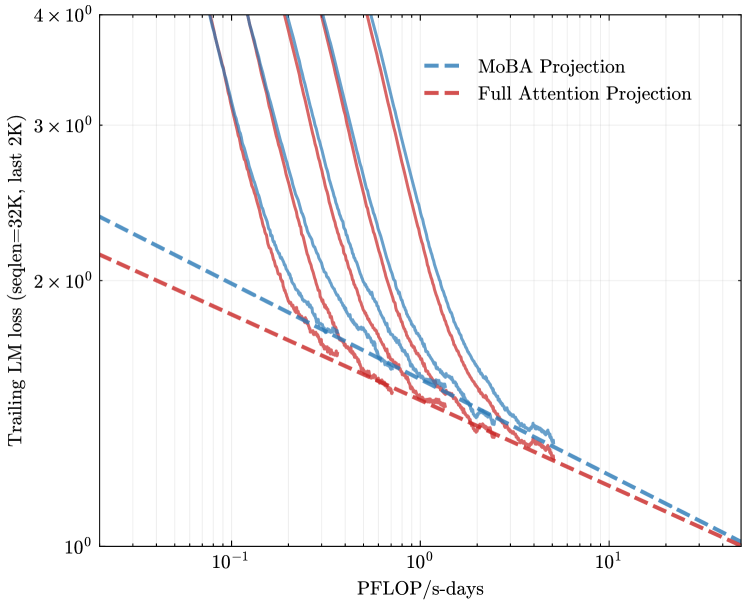
The image is a logarithmic line graph comparing two computational efficiency projections: "MoBA Projection" (dashed blue line) and "Full Attention Projection" (dashed red line). The graph illustrates how trailing language model (LM) loss decreases with increasing computational resources (PFLOP/s-days). Both lines exhibit exponential decay trends, but with distinct divergence patterns.
### Components/Axes
- **Y-axis**: "Trailing LM loss (seqLen=32K, last 2K)"
- Logarithmic scale from 10⁰ to 4×10⁰ (1 to 4 on linear scale).
- Positioned on the left side of the graph.
- **X-axis**: "PFLOP/s-days"
- Logarithmic scale from 10⁻¹ to 10¹ (0.1 to 10 on linear scale).
- Positioned at the bottom of the graph.
- **Legend**: Located in the top-right corner.
- Blue dashed line: "MoBA Projection"
- Red dashed line: "Full Attention Projection"
### Detailed Analysis
1. **MoBA Projection (Blue Dashed Line)**:
- Starts at ~2×10⁰ loss at 10⁻¹ PFLOP/s-days.
- Declines steeply, reaching ~1×10⁰ at 10⁰ PFLOP/s-days.
- Continues to drop to ~0.5×10⁰ by 10¹ PFLOP/s-days.
- Final value approaches ~0.1×10⁰ at the far right (10¹ PFLOP/s-days).
2. **Full Attention Projection (Red Dashed Line)**:
- Begins at ~2×10⁰ loss at 10⁻¹ PFLOP/s-days.
- Decreases more gradually, remaining above 1×10⁰ until ~10⁰.⁵ PFLOP/s-days.
- Drops to ~1×10⁰ at 10¹ PFLOP/s-days.
- Final value converges with MoBA Projection near 0.1×10⁰.
3. **Key Intersection Points**:
- Both lines intersect near 10⁰ PFLOP/s-days (~1×10⁰ loss).
- Converge again at 10¹ PFLOP/s-days (~0.1×10⁰ loss).
### Key Observations
- **Divergence**: MoBA Projection achieves significantly lower loss than Full Attention Projection at mid-range computational resources (10⁰–10⁰.⁵ PFLOP/s-days).
- **Convergence**: Both projections yield similar efficiency at extreme computational scales (10¹ PFLOP/s-days).
- **Efficiency**: MoBA Projection demonstrates ~2× better loss reduction than Full Attention Projection at 10⁰ PFLOP/s-days.
### Interpretation
The graph suggests that MoBA Projection is computationally more efficient for reducing trailing LM loss in the early to mid-stages of scaling (up to 10⁰.⁵ PFLOP/s-days). However, at extreme computational scales (10¹ PFLOP/s-days), both approaches achieve comparable efficiency, implying diminishing returns for additional resources. This could indicate architectural trade-offs: MoBA may prioritize early-stage optimization, while Full Attention Projection balances resource allocation differently. The logarithmic axes emphasize exponential scaling effects, highlighting the importance of computational efficiency in large-scale LM training.