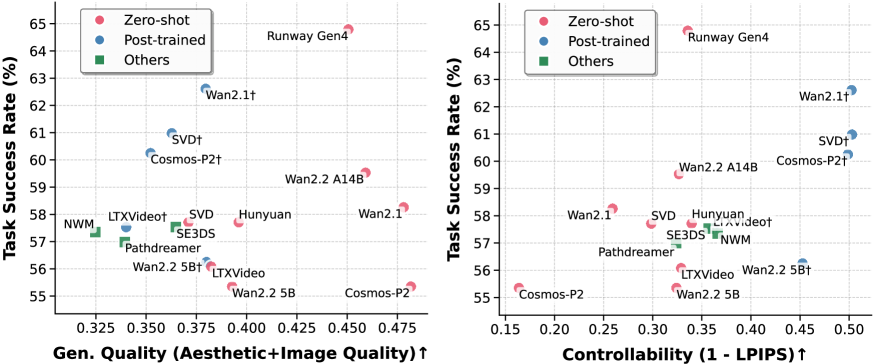
## Scatter Plots: Model Performance Comparison
### Overview
The image contains two side-by-side scatter plots comparing model performance across two metrics: **Gen. Quality (Aesthetic+Image Quality)** and **Controllability (1 - LPIPS)**. Both plots share the same y-axis (**Task Success Rate (%)**), while the x-axes differ. Data points are color-coded by model type: **Zero-shot (red)**, **Post-trained (blue)**, and **Others (green)**.
---
### Components/Axes
#### Left Panel: Gen. Quality vs. Task Success Rate
- **X-axis (Gen. Quality)**: Ranges from **0.325** to **0.475** (increasing rightward).
- **Y-axis (Task Success Rate)**: Ranges from **55%** to **65%** (increasing upward).
- **Legend**:
- **Red**: Zero-shot
- **Blue**: Post-trained
- **Green**: Others
#### Right Panel: Controllability vs. Task Success Rate
- **X-axis (Controllability)**: Ranges from **0.15** to **0.50** (increasing rightward).
- **Y-axis (Task Success Rate)**: Same as left panel (**55%** to **65%**).
- **Legend**: Same as left panel.
---
### Detailed Analysis
#### Left Panel: Gen. Quality vs. Task Success Rate
- **Zero-shot (Red)**:
- **Runway Gen4**: (0.475, 64%)
- **Wan2.2 A14B**: (0.45, 59%)
- **Cosmos-P2**: (0.475, 55%)
- **Post-trained (Blue)**:
- **Wan2.1†**: (0.400, 62%)
- **SVD†**: (0.375, 61%)
- **Cosmos-P2†**: (0.375, 60%)
- **Others (Green)**:
- **NWM**: (0.325, 57%)
- **Pathdreamer**: (0.35, 56%)
- **SE3DS**: (0.375, 56%)
- **LTXVideo**: (0.375, 57%)
- **Hunyuan**: (0.400, 58%)
- **Wan2.2 5B**: (0.400, 56%)
#### Right Panel: Controllability vs. Task Success Rate
- **Zero-shot (Red)**:
- **Runway Gen4**: (0.45, 64%)
- **Wan2.2 A14B**: (0.30, 59%)
- **Cosmos-P2**: (0.15, 55%)
- **Post-trained (Blue)**:
- **Wan2.1†**: (0.45, 62%)
- **SVD†**: (0.45, 61%)
- **Cosmos-P2†**: (0.45, 60%)
- **Others (Green)**:
- **Pathdreamer**: (0.30, 57%)
- **SE3DS**: (0.30, 57%)
- **NWM**: (0.30, 57%)
- **LTXVideo**: (0.30, 58%)
- **Hunyuan**: (0.30, 59%)
- **Wan2.2 5B**: (0.35, 56%)
---
### Key Observations
1. **High Gen. Quality, High Task Success Rate**:
- **Runway Gen4** (Zero-shot) achieves the highest Gen. Quality (**0.475**) and Task Success Rate (**64%**) in both panels.
- **Wan2.1†** (Post-trained) shows strong performance with Gen. Quality (**0.400**) and Task Success Rate (**62%**).
2. **Outliers**:
- **Cosmos-P2** (Zero-shot) has high Gen. Quality (**0.475**) but low Task Success Rate (**55%**), suggesting inefficiency.
- **Cosmos-P2** (Others) has low Controllability (**0.15**) and Task Success Rate (**55%**), indicating poor optimization.
3. **Post-trained Models**:
- Post-trained models (e.g., **Wan2.1†**, **SVD†**) consistently outperform Zero-shot and Others in both panels, suggesting training improves performance.
4. **Controllability Trends**:
- Higher Controllability (closer to 0.50) correlates with higher Task Success Rate, especially for Post-trained models.
---
### Interpretation
- **Model Efficiency**: Post-trained models (blue) demonstrate superior Task Success Rate across both Gen. Quality and Controllability, implying training enhances effectiveness.
- **Trade-offs**: Zero-shot models like **Runway Gen4** excel in Gen. Quality but may lack Controllability, while **Cosmos-P2** (Zero-shot) underperforms despite high Gen. Quality.
- **Outliers**: **Cosmos-P2** (Others) is a clear outlier, with low Controllability and Task Success Rate, suggesting it is less optimized compared to others.
- **Correlation**: Both panels show a positive correlation between Gen. Quality/Controllability and Task Success Rate, though Post-trained models break this trend by achieving higher success rates at lower Gen. Quality/Controllability.
This analysis highlights the importance of model training in balancing Gen. Quality, Controllability, and Task Success Rate, with Post-trained models leading in performance.