## Line Chart: Model Performance Comparison (SimpleQA vs. BrowseComp)
### Overview
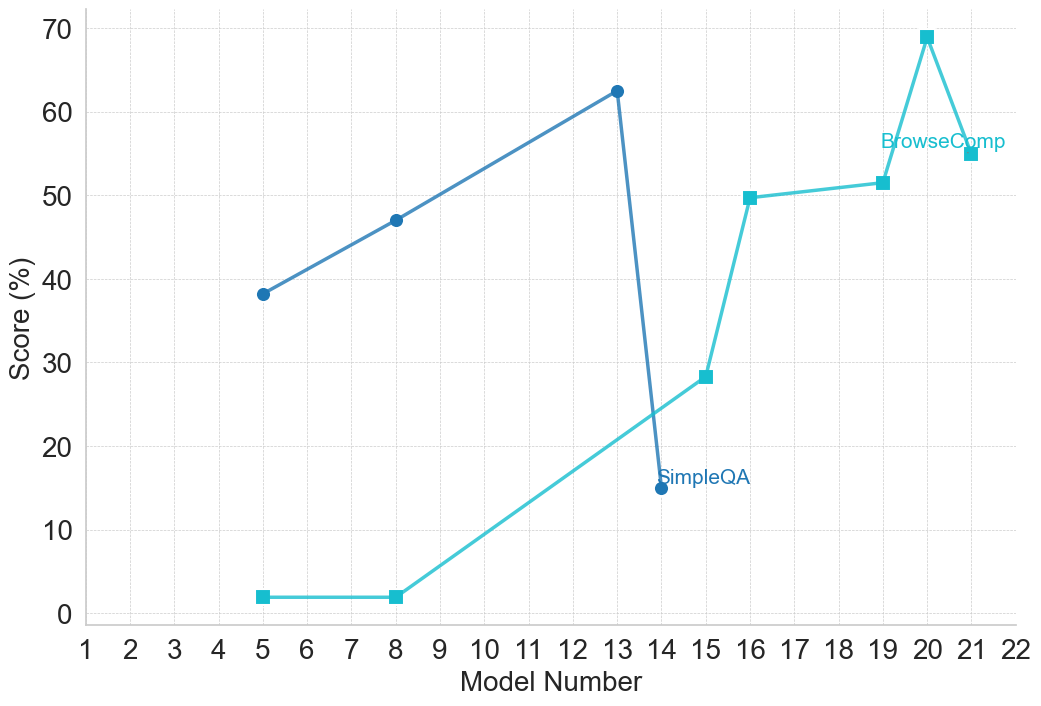
The image is a line chart comparing the performance scores (in percentage) of two different evaluation metrics or tasks, labeled "SimpleQA" and "BrowseComp," across a series of model iterations identified by "Model Number." The chart displays two distinct trends: one metric shows an initial rise followed by a sharp decline, while the other shows a generally upward trajectory with a late peak.
### Components/Axes
* **Chart Type:** Line chart with markers.
* **X-Axis:** Labeled "Model Number." It is a linear scale with major tick marks and labels for every integer from 1 to 22.
* **Y-Axis:** Labeled "Score (%)." It is a linear scale ranging from 0 to 70, with major grid lines and labels at intervals of 10 (0, 10, 20, 30, 40, 50, 60, 70).
* **Legend:** Located in the top-right quadrant of the chart area, near the data points for higher model numbers.
* **SimpleQA:** Represented by a dark blue line with circular markers.
* **BrowseComp:** Represented by a light blue (cyan) line with square markers.
* **Grid:** A light gray, dashed grid is present for both major x and y axis intervals.
### Detailed Analysis
**Data Series 1: SimpleQA (Dark Blue Line, Circle Markers)**
* **Trend Verification:** The line slopes upward from model 5 to model 13, then drops precipitously at model 14.
* **Data Points (Approximate):**
* Model 5: ~38%
* Model 8: ~47%
* Model 13: ~62% (Peak for this series)
* Model 14: ~15% (Sharp decline)
**Data Series 2: BrowseComp (Light Blue Line, Square Markers)**
* **Trend Verification:** The line is flat at a very low level for early models, then begins a steady upward climb from model 8 onward, with a significant jump between models 15 and 16, and a final peak at model 20.
* **Data Points (Approximate):**
* Model 5: ~2%
* Model 8: ~2%
* Model 15: ~28%
* Model 16: ~50%
* Model 19: ~52%
* Model 20: ~69% (Peak for the entire chart)
* Model 21: ~55%
### Key Observations
1. **Divergent Trajectories:** The two metrics show fundamentally different performance patterns across the model sequence. SimpleQA peaks early (model 13) and then collapses, while BrowseComp shows late-stage, significant improvement.
2. **Performance Crossover:** The BrowseComp line surpasses the SimpleQA line between model 14 and model 15. After model 14, SimpleQA's score is lower than BrowseComp's for all subsequent data points shown.
3. **Notable Anomalies:**
* The **~47 percentage point drop** in SimpleQA score from model 13 (~62%) to model 14 (~15%) is the most dramatic single change in the chart.
* The **~21 percentage point jump** in BrowseComp score from model 15 (~28%) to model 16 (~50%) is the largest single increase for that series.
* The **peak score** for the entire dataset is achieved by BrowseComp at model 20 (~69%).
### Interpretation
This chart likely visualizes the results of an iterative model development or testing process. The "Model Number" suggests sequential versions or configurations.
* **SimpleQA** appears to be a task or benchmark where performance was initially optimized but then suffered a catastrophic failure or was fundamentally altered at model 14. This could indicate a change in the model's architecture, training data, or the evaluation methodology for that specific task that was highly detrimental.
* **BrowseComp** demonstrates a classic learning or optimization curve. Early models (5, 8) performed poorly, but starting around model 15, there was a breakthrough leading to rapid and substantial gains, peaking at model 20. The slight dip at model 21 might represent a minor regression, overfitting, or a trade-off made to improve another metric.
* The **inverse relationship** after model 14 is striking. It suggests that the modifications made to the models from version 14 onward, while beneficial for the "BrowseComp" capability, were actively harmful to the "SimpleQA" capability. This could point to a tension or trade-off between the skills required for these two different tasks (e.g., factual recall vs. complex browsing/comparison).
**In summary, the data tells a story of divergent development paths: a specialized capability (BrowseComp) was successfully cultivated in later models at the apparent expense of a different, perhaps more fundamental, capability (SimpleQA).**