## Log-Log Plot: Validation Perplexity vs. Step and Tokens for Different Recurrence Values
### Overview
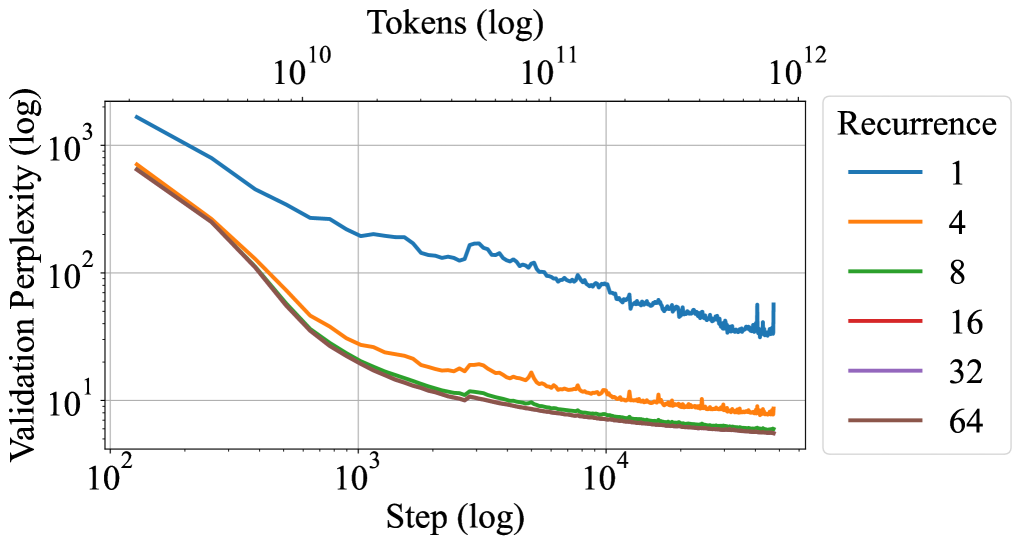
The image is a log-log plot showing the relationship between validation perplexity and training step (and tokens) for different recurrence values. The plot displays how validation perplexity decreases with increasing training steps, with different lines representing different recurrence values. The x-axis represents the training step (log) and tokens (log), while the y-axis represents the validation perplexity (log). The plot includes a legend indicating the recurrence value associated with each line.
### Components/Axes
* **Title:** None explicitly provided in the image.
* **X-axis:**
* Label: "Step (log)"
* Scale: Logarithmic, with markers at 10<sup>2</sup>, 10<sup>3</sup>, 10<sup>4</sup>.
* Secondary Label: "Tokens (log)"
* Secondary Scale: Logarithmic, with markers at 10<sup>10</sup>, 10<sup>11</sup>, 10<sup>12</sup>.
* **Y-axis:**
* Label: "Validation Perplexity (log)"
* Scale: Logarithmic, with markers at 10<sup>0</sup>, 10<sup>1</sup>, 10<sup>2</sup>, 10<sup>3</sup>.
* **Legend:** Located in the top-right corner.
* Title: "Recurrence"
* Entries:
* Blue line: 1
* Orange line: 4
* Green line: 8
* Red line: 16
* Purple line: 32
* Brown line: 64
### Detailed Analysis
The plot shows six lines, each representing a different recurrence value. All lines generally show a decreasing trend, indicating that validation perplexity decreases as the training step increases.
* **Recurrence = 1 (Blue):** Starts at approximately 1500 perplexity at step 10<sup>2</sup>. The line decreases rapidly initially, then plateaus and fluctuates around 50-100 perplexity after step 10<sup>3</sup>.
* **Recurrence = 4 (Orange):** Starts at approximately 700 perplexity at step 10<sup>2</sup>. The line decreases rapidly and plateaus around 10 perplexity after step 10<sup>3</sup>.
* **Recurrence = 8 (Green):** Starts at approximately 600 perplexity at step 10<sup>2</sup>. The line decreases rapidly and plateaus around 5 perplexity after step 10<sup>3</sup>.
* **Recurrence = 16 (Red):** Starts at approximately 500 perplexity at step 10<sup>2</sup>. The line decreases rapidly and plateaus around 5 perplexity after step 10<sup>3</sup>.
* **Recurrence = 32 (Purple):** Starts at approximately 500 perplexity at step 10<sup>2</sup>. The line decreases rapidly and plateaus around 3 perplexity after step 10<sup>3</sup>.
* **Recurrence = 64 (Brown):** Starts at approximately 500 perplexity at step 10<sup>2</sup>. The line decreases rapidly and plateaus around 3 perplexity after step 10<sup>3</sup>.
### Key Observations
* The validation perplexity decreases as the training step increases for all recurrence values.
* Higher recurrence values (8, 16, 32, 64) result in lower validation perplexity compared to lower recurrence values (1, 4) after a certain number of steps.
* The line for recurrence = 1 shows more fluctuation and plateaus at a higher perplexity compared to other recurrence values.
* The lines for recurrence values 8, 16, 32, and 64 are very close to each other, suggesting that increasing recurrence beyond 8 has diminishing returns in terms of reducing validation perplexity.
### Interpretation
The plot suggests that increasing the recurrence value generally leads to lower validation perplexity, indicating better model performance. However, there appears to be a point of diminishing returns, as recurrence values above 8 do not significantly improve the validation perplexity. The fluctuations in the recurrence = 1 line suggest that a lower recurrence value may lead to less stable training. The relationship between the training step and tokens is linear on a log-log scale, implying a power-law relationship between them. The data demonstrates the impact of recurrence on model performance, highlighting the importance of choosing an appropriate recurrence value for optimal results.