## Line Chart: Accuracy vs. Thinking Compute
### Overview
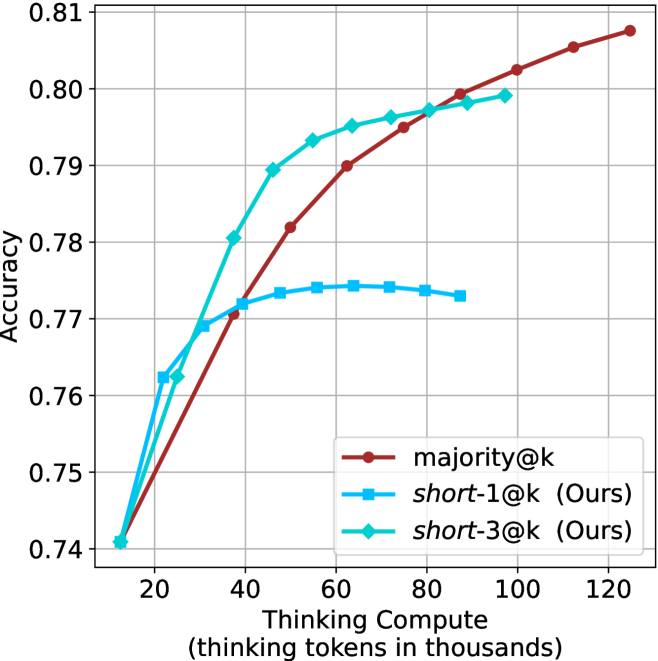
The image is a line chart comparing the accuracy of three different methods ("majority@k", "short-1@k (Ours)", and "short-3@k (Ours)") as a function of "Thinking Compute" (measured in thousands of thinking tokens). The chart displays how accuracy changes with increasing computational effort for each method.
### Components/Axes
* **X-axis:** Thinking Compute (thinking tokens in thousands). Scale ranges from approximately 10 to 120, with tick marks at intervals of 20.
* **Y-axis:** Accuracy. Scale ranges from 0.74 to 0.81, with tick marks at intervals of 0.01.
* **Legend:** Located in the bottom-right corner of the chart.
* **Brown line with circle markers:** "majority@k"
* **Blue line with square markers:** "short-1@k (Ours)"
* **Cyan line with diamond markers:** "short-3@k (Ours)"
### Detailed Analysis
* **majority@k (Brown line):** The line starts at approximately (15, 0.74) and slopes upward.
* (15, 0.74)
* (40, 0.77)
* (60, 0.79)
* (80, 0.80)
* (100, 0.805)
* (125, 0.81)
* **short-1@k (Ours) (Blue line):** The line starts at approximately (15, 0.74) and increases to a peak, then decreases slightly.
* (15, 0.74)
* (30, 0.77)
* (50, 0.774)
* (70, 0.774)
* (90, 0.772)
* **short-3@k (Ours) (Cyan line):** The line starts at approximately (15, 0.74) and slopes upward, plateauing around 80.
* (15, 0.74)
* (25, 0.762)
* (40, 0.79)
* (60, 0.795)
* (80, 0.798)
* (100, 0.798)
### Key Observations
* Initially, "short-3@k (Ours)" achieves higher accuracy with less compute compared to "majority@k" and "short-1@k (Ours)".
* "short-1@k (Ours)" plateaus and even slightly decreases in accuracy after a certain compute level.
* "majority@k" consistently increases in accuracy with increasing compute, eventually surpassing "short-3@k (Ours)".
### Interpretation
The chart suggests that "short-3@k (Ours)" is more efficient in terms of accuracy gain for lower compute budgets. However, "majority@k" eventually outperforms the other methods with sufficient computational resources. "short-1@k (Ours)" appears to have diminishing returns and may not be as effective for higher compute levels. The data indicates a trade-off between initial efficiency and long-term performance depending on the available compute. The "Ours" label suggests that "short-1@k" and "short-3@k" are novel methods being compared against the baseline "majority@k".