## Line Chart: Accuracy vs. Thinking Compute
### Overview
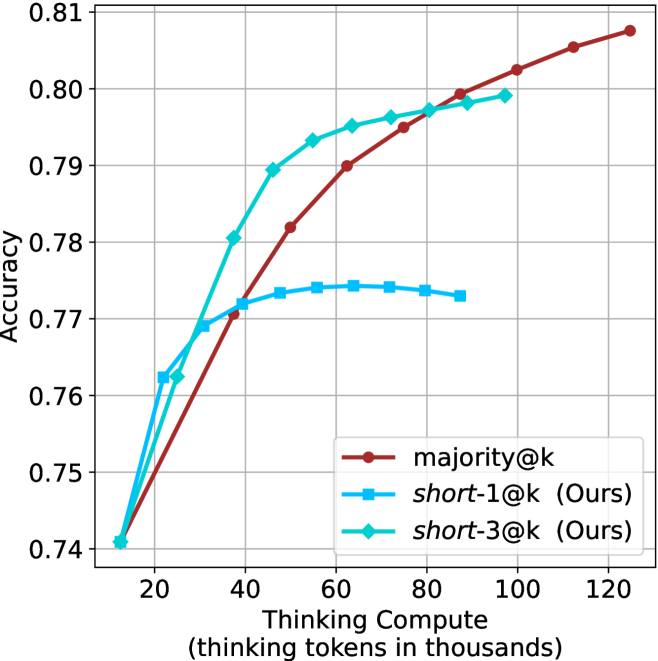
This chart illustrates the relationship between "Thinking Compute" (measured in thousands of thinking tokens) and model "Accuracy." It compares three distinct methods: a baseline method labeled `majority@k` and two methods labeled `short-1@k (Ours)` and `short-3@k (Ours)`. The chart demonstrates how accuracy scales as additional computational resources are allocated to the thinking process.
### Components/Axes
* **Y-Axis:** Labeled "Accuracy." The scale ranges from 0.74 to 0.81, with major grid lines at 0.01 intervals.
* **X-Axis:** Labeled "Thinking Compute (thinking tokens in thousands)." The scale ranges from 20 to 120, with major grid lines at 20-unit intervals. Data points begin at approximately 12k tokens.
* **Legend (Bottom-Right):**
* **Dark Red (Circle markers):** `majority@k`
* **Blue (Square markers):** `short-1@k (Ours)`
* **Cyan/Teal (Diamond markers):** `short-3@k (Ours)`
### Detailed Analysis
The chart displays three distinct data series, all originating from a common starting point at approximately 12k tokens and 0.741 accuracy.
**1. `majority@k` (Dark Red, Circle markers)**
* **Trend:** This series exhibits a consistent, near-linear upward slope throughout the entire range. It does not show signs of plateauing within the visible chart area.
* **Data Points (Approximate):**
* ~38k tokens: ~0.770 accuracy
* ~50k tokens: ~0.782 accuracy
* ~65k tokens: ~0.790 accuracy
* ~80k tokens: ~0.795 accuracy
* ~100k tokens: ~0.802 accuracy
* ~125k tokens: ~0.808 accuracy
**2. `short-1@k (Ours)` (Blue, Square markers)**
* **Trend:** This series shows a rapid initial increase in accuracy, followed by a distinct plateau starting around 45k tokens. It reaches a peak and then exhibits a slight decline or stagnation.
* **Data Points (Approximate):**
* ~22k tokens: ~0.762 accuracy
* ~32k tokens: ~0.769 accuracy
* ~45k tokens: ~0.772 accuracy
* ~65k tokens: ~0.774 accuracy (Peak)
* ~88k tokens: ~0.773 accuracy
**3. `short-3@k (Ours)` (Cyan/Teal, Diamond markers)**
* **Trend:** This series shows the steepest initial growth, outperforming the other two methods in the 20k–60k token range. It begins to plateau after 60k tokens, eventually trailing off as it approaches 100k tokens.
* **Data Points (Approximate):**
* ~25k tokens: ~0.762 accuracy
* ~38k tokens: ~0.780 accuracy
* ~55k tokens: ~0.793 accuracy
* ~75k tokens: ~0.796 accuracy
* ~98k tokens: ~0.799 accuracy
### Key Observations
* **Efficiency vs. Scaling:** The "Ours" methods (`short-1@k` and `short-3@k`) are highly efficient at low compute levels, providing rapid accuracy gains compared to the baseline. However, they suffer from diminishing returns (plateauing) much earlier than the `majority@k` method.
* **Baseline Superiority:** The `majority@k` method is the most scalable. While it starts slower than the "Ours" methods, it overtakes `short-1@k` around 35k tokens and continues to climb, eventually becoming the highest-performing method as compute increases beyond 90k tokens.
* **Performance Gap:** There is a clear hierarchy in peak performance: `majority@k` > `short-3@k` > `short-1@k`.
### Interpretation
The data suggests a classic trade-off between "quick wins" and "long-term scaling." The "Ours" methods appear to be optimized for scenarios where computational budget is constrained, as they reach a respectable accuracy level with significantly fewer tokens than the baseline.
However, the `majority@k` method demonstrates better asymptotic behavior. If the application allows for high compute usage (e.g., >100k tokens), the `majority@k` approach is objectively superior. The `short-3@k` method serves as a strong middle-ground, offering significantly better performance than `short-1@k` while maintaining a steeper initial learning curve than the baseline. This implies that the "Ours" methods might be using a heuristic or strategy that is effective for simple reasoning but lacks the depth or robustness required for the highest levels of accuracy achieved by the `majority@k` baseline.