## Line Graph: Accuracy Over Time (Acc_test vs. t)
### Overview
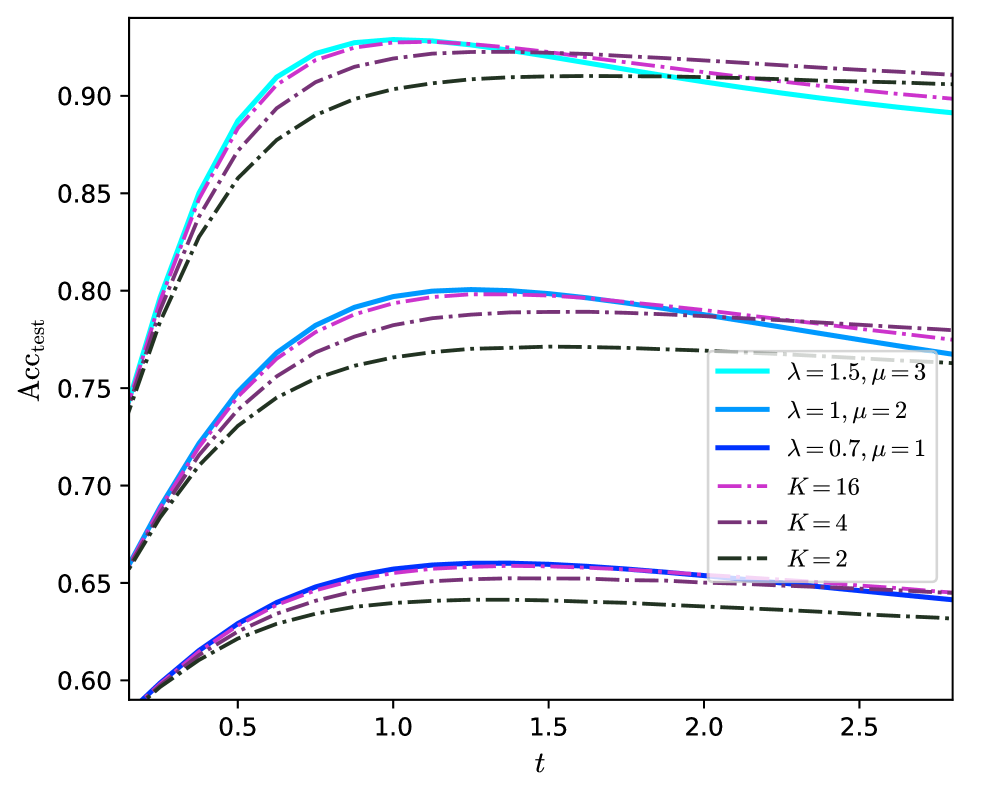
The graph depicts the relationship between time (`t`) and test accuracy (`Acc_test`) for different parameter configurations. Six distinct lines represent combinations of learning rate (`λ`), regularization strength (`μ`), and model complexity (`K`). All lines exhibit a similar sigmoidal trend, peaking around `t=1` before declining.
### Components/Axes
- **X-axis**: Time (`t`), ranging from 0.0 to 2.5 in increments of 0.5.
- **Y-axis**: Test accuracy (`Acc_test`), ranging from 0.60 to 0.90 in increments of 0.05.
- **Legend**: Located in the bottom-right corner, mapping colors to parameters:
- Solid lines: Learning rate (`λ`) and regularization (`μ`) combinations.
- Dashed lines: Model complexity (`K`) values.
- **Line styles**:
- Cyan: `λ=1.5, μ=3`
- Blue: `λ=1, μ=2`
- Dark blue: `λ=0.7, μ=1`
- Magenta (dashed): `K=16`
- Purple (dashed): `K=4`
- Black (dashed): `K=2`
### Detailed Analysis
1. **`λ=1.5, μ=3` (cyan)**:
- Peaks at `t=1` with `Acc_test ≈ 0.90`.
- Declines steadily to `0.88` by `t=2.5`.
- Highest accuracy among all lines.
2. **`λ=1, μ=2` (blue)**:
- Peaks at `t=1` with `Acc_test ≈ 0.89`.
- Declines to `0.87` by `t=2.5`.
- Second-highest accuracy.
3. **`λ=0.7, μ=1` (dark blue)**:
- Peaks at `t=1` with `Acc_test ≈ 0.88`.
- Declines to `0.86` by `t=2.5`.
- Third-highest accuracy.
4. **`K=16` (magenta, dashed)**:
- Peaks at `t=1` with `Acc_test ≈ 0.89`.
- Declines to `0.87` by `t=2.5`.
- Matches the `λ=1, μ=2` line in accuracy.
5. **`K=4` (purple, dashed)**:
- Peaks at `t=1` with `Acc_test ≈ 0.87`.
- Declines to `0.85` by `t=2.5`.
- Matches the `λ=0.7, μ=1` line in accuracy.
6. **`K=2` (black, dashed)**:
- Peaks at `t=1` with `Acc_test ≈ 0.85`.
- Declines to `0.83` by `t=2.5`.
- Lowest accuracy among all lines.
### Key Observations
- **Parameter correlation**: Higher `λ` and `μ` values correlate with higher peak accuracy (e.g., `λ=1.5, μ=3` outperforms `λ=0.7, μ=1`).
- **Model complexity**: Larger `K` values (e.g., `K=16`) achieve accuracy comparable to moderate `λ`/`μ` combinations.
- **Consistent trends**: All lines follow a sigmoidal pattern, suggesting diminishing returns after `t=1`.
- **Color consistency**: Legend colors match line styles and parameter groupings exactly.
### Interpretation
The graph demonstrates that:
1. **Learning rate and regularization** (`λ`, `μ`) significantly impact peak accuracy, with higher values yielding better performance.
2. **Model complexity** (`K`) acts as a proxy for capacity, where larger `K` values achieve similar accuracy to optimized `λ`/`μ` pairs.
3. The decline after `t=1` implies potential overfitting or saturation effects, as further training reduces generalization.
4. The `K=2` line (lowest accuracy) suggests underfitting due to insufficient model capacity.
This analysis highlights the trade-offs between hyperparameter tuning and architectural complexity in optimizing test accuracy.