\n
## Bar Chart: Refreshes Comparison
### Overview
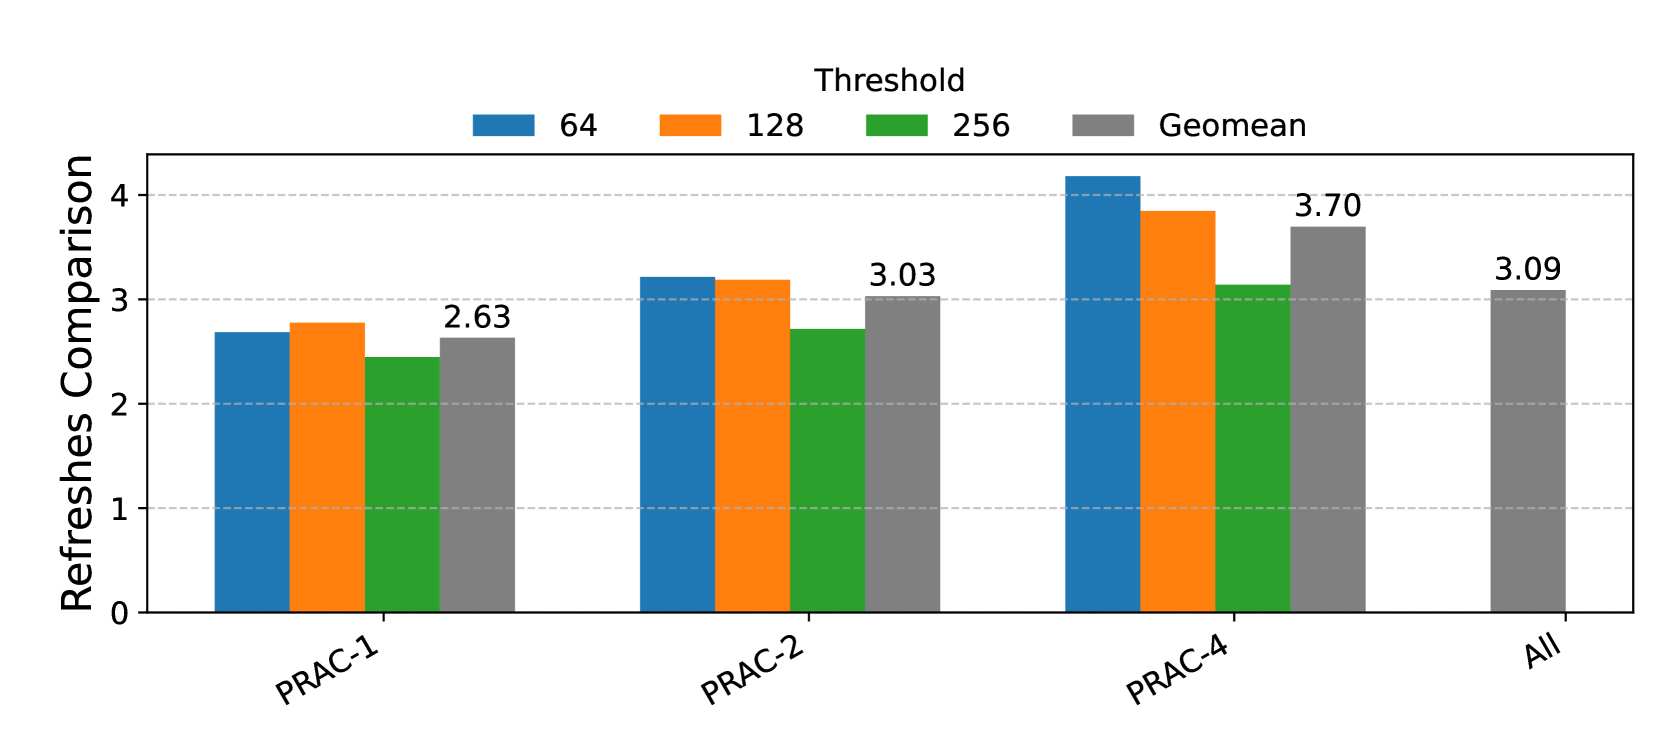
The image presents a bar chart comparing "Refreshes" across four different categories: PRAC-1, PRAC-2, PRAC-4, and "All". The chart displays data for four different thresholds: 64, 128, 256, and the geometric mean (Geomean). The y-axis represents the value of "Refreshes Comparison", ranging from 0 to 4.
### Components/Axes
* **Y-axis:** "Refreshes Comparison" (Scale: 0 to 4, increments of 1)
* **X-axis:** Categories: PRAC-1, PRAC-2, PRAC-4, All
* **Legend:** Located at the top-right of the chart.
* Blue: Threshold 64
* Orange: Threshold 128
* Green: Threshold 256
* Gray: Geomean
### Detailed Analysis
The chart consists of four groups of bars, one for each category on the x-axis. Each group contains four bars, representing the four thresholds.
* **PRAC-1:**
* Threshold 64: Approximately 2.80
* Threshold 128: Approximately 2.40
* Threshold 256: Approximately 1.00
* Geomean: 2.63
* **PRAC-2:**
* Threshold 64: Approximately 3.10
* Threshold 128: Approximately 3.20
* Threshold 256: Approximately 1.00
* Geomean: 3.03
* **PRAC-4:**
* Threshold 64: Approximately 4.20
* Threshold 128: Approximately 3.80
* Threshold 256: Approximately 1.00
* Geomean: 3.70
* **All:**
* Threshold 64: Approximately 3.00
* Threshold 128: Approximately 3.00
* Threshold 256: Approximately 1.00
* Geomean: 3.09
The bars for Threshold 256 are consistently low (around 1.00) across all categories. The Geomean values are generally higher than the Threshold 256 bars, but lower than the Threshold 64 and 128 bars.
### Key Observations
* PRAC-4 consistently shows the highest values for Thresholds 64 and 128.
* Threshold 256 consistently shows the lowest values across all categories.
* The Geomean values are relatively stable across the categories, hovering around 3.0.
* The difference between the Threshold 64/128 bars and the Geomean bar is most pronounced in PRAC-4.
### Interpretation
The chart demonstrates the impact of different thresholds on the number of refreshes. The consistently low values for the 256 threshold suggest that this threshold is rarely triggered, or that refreshes are not needed at this level. The higher values for the 64 and 128 thresholds indicate that these thresholds are more frequently met, leading to more refreshes.
The Geomean provides a central tendency measure, indicating the typical number of refreshes across all thresholds. The fact that the Geomean is lower than the 64 and 128 thresholds suggests that the lower thresholds are driving the overall refresh rate.
The significant difference between the thresholds and the Geomean in PRAC-4 suggests that this category is particularly sensitive to the lower thresholds, and that reducing the refresh rate at these thresholds could have a substantial impact on overall performance. The "All" category provides a baseline for comparison, showing that the overall refresh rate is similar to that of PRAC-2.