## Line Chart: Accuracy vs. Thinking Compute
### Overview
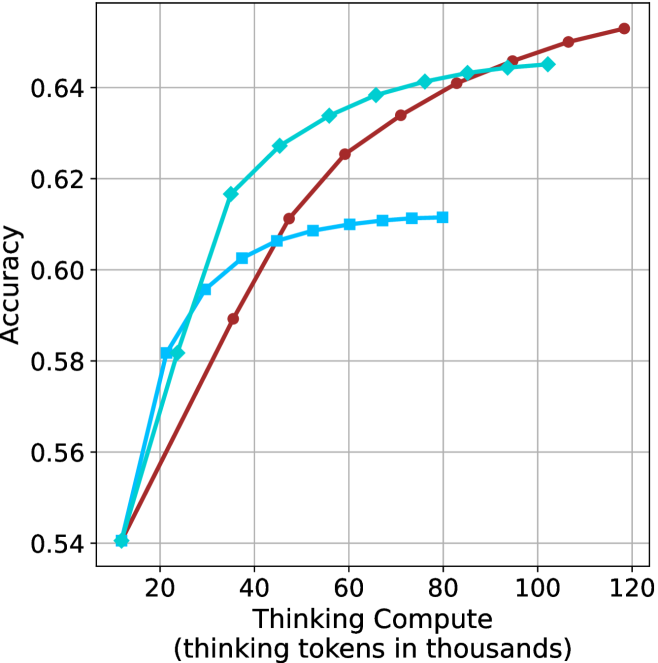
This image displays a line chart comparing the performance of three distinct data series (likely different AI models or configurations) based on their "Thinking Compute" (measured in thousands of tokens) versus their "Accuracy." The chart illustrates how increasing computational resources (thinking tokens) impacts the accuracy of each model, demonstrating diminishing returns for all series.
### Components/Axes
* **X-Axis:** Labeled "Thinking Compute (thinking tokens in thousands)." The scale ranges from 20 to 120, with grid lines at intervals of 20. The data series originate at approximately 12.
* **Y-Axis:** Labeled "Accuracy." The scale ranges from 0.54 to 0.64, with grid lines at intervals of 0.02.
* **Data Series:**
1. **Dark Red Line (Circle markers):** Represents a model with steady, sustained growth.
2. **Cyan Line (Diamond markers):** Represents a model with rapid initial growth that eventually plateaus.
3. **Cyan Line (Square markers):** Represents a model with rapid initial growth that plateaus significantly earlier than the others.
### Detailed Analysis
All three data series originate from the same starting point at approximately **(12, 0.54)**.
**1. Dark Red Line (Circle markers)**
* **Trend:** This line shows the most consistent, linear-to-logarithmic growth. It does not plateau as sharply as the cyan lines.
* **Data Points (Approximate):**
* Starts at (12, 0.54).
* (35, 0.59)
* (47, 0.61)
* (60, 0.625)
* (72, 0.635)
* (83, 0.64)
* (95, 0.645)
* (105, 0.65)
* Ends at (118, 0.652)
**2. Cyan Line (Diamond markers)**
* **Trend:** This line shows very steep growth initially, outperforming the red line until approximately 90k tokens. After 60k tokens, the rate of improvement slows significantly (plateauing).
* **Data Points (Approximate):**
* Starts at (12, 0.54).
* (21, 0.58)
* (24, 0.582)
* (35, 0.617)
* (45, 0.628)
* (55, 0.634)
* (65, 0.639)
* (75, 0.641)
* (85, 0.643)
* (95, 0.644)
* Ends at (102, 0.645)
**3. Cyan Line (Square markers)**
* **Trend:** This line shows the steepest initial growth but hits a hard ceiling very early, around 40k-50k tokens.
* **Data Points (Approximate):**
* Starts at (12, 0.54).
* (21, 0.582)
* (29, 0.595)
* (33, 0.602)
* (45, 0.606)
* (52, 0.608)
* (60, 0.61)
* (72, 0.611)
* Ends at (80, 0.612)
### Key Observations
* **Crossover Point:** The Dark Red line overtakes the Cyan-Diamond line at approximately 90k-95k tokens.
* **Efficiency vs. Capacity:** The Cyan-Diamond model is the most efficient choice for lower compute budgets (under 80k tokens), while the Dark Red model is superior for higher compute budgets.
* **Diminishing Returns:** All three lines exhibit a concave shape, indicating that as more "thinking tokens" are added, the marginal gain in accuracy decreases.
* **Early Plateau:** The Cyan-Square model is clearly the least capable at higher compute levels, suggesting it may be a smaller model or one with a lower "reasoning capacity" ceiling.
### Interpretation
This chart is a classic representation of **scaling laws in Large Language Models (LLMs)**, specifically regarding "test-time compute" or "thinking" tokens (similar to the behavior observed in models like OpenAI's o1).
* **The "Thinking" Trade-off:** The data demonstrates that simply adding more compute (tokens) does not guarantee infinite accuracy gains. Each model has a "saturation point" where adding more tokens yields negligible improvements.
* **Model Architecture Differences:** The three lines likely represent different model sizes or training checkpoints. The Cyan-Square line likely represents a smaller model that saturates quickly. The Dark Red line likely represents a larger, more robust model that continues to benefit from additional compute long after the smaller models have plateaued.
* **Strategic Implications:** For a developer or user, this chart suggests that if you have a limited compute budget (e.g., < 40k tokens), the Cyan-Diamond model is optimal. However, if you have a high compute budget (e.g., > 100k tokens), the Dark Red model is the only one that continues to provide meaningful accuracy improvements.