## Chart: Importance Score vs. Reasoning Step
### Overview
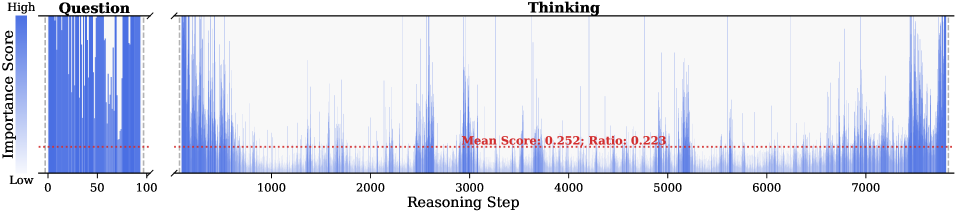
The image presents a chart showing the "Importance Score" over "Reasoning Step" for two phases: "Question" and "Thinking". The "Question" phase is represented as a vertical bar chart, while the "Thinking" phase is represented as a line chart. A horizontal dotted line indicates the mean score and ratio for the "Thinking" phase.
### Components/Axes
* **Y-axis (Vertical):** "Importance Score" ranging from "Low" to "High". The color gradient from low to high is a light blue to a darker blue.
* **X-axis (Horizontal):** "Reasoning Step" ranging from 0 to approximately 7500.
* **Title:** "Thinking" is the title for the main chart.
* **Left-side Chart Title:** "Question" is the title for the left-side chart.
* **Horizontal Dotted Line:** Represents "Mean Score: 0.252; Ratio: 0.223" for the "Thinking" phase.
### Detailed Analysis
**1. Question Phase (Left-side Chart):**
* The x-axis ranges from 0 to 100.
* The "Importance Score" fluctuates significantly across the "Reasoning Step" in the "Question" phase.
* Many data points reach the "High" level of "Importance Score".
* The mean score line is present in this chart as well.
**2. Thinking Phase (Main Chart):**
* The x-axis ranges from 0 to approximately 7500.
* The "Importance Score" generally decreases after the initial steps and then fluctuates with several peaks.
* The "Importance Score" appears to increase towards the end of the "Reasoning Step".
* The horizontal dotted line representing the "Mean Score: 0.252; Ratio: 0.223" is positioned approximately at a score of 0.25 on the y-axis.
### Key Observations
* The "Question" phase shows a high degree of importance score throughout the reasoning steps.
* The "Thinking" phase starts with high importance scores, which then decrease and fluctuate around the mean score.
* There are spikes in the "Importance Score" at various points in the "Thinking" phase.
### Interpretation
The chart compares the "Importance Score" during the "Question" and "Thinking" phases of a reasoning process. The "Question" phase is characterized by consistently high importance scores, suggesting that the initial questioning or problem definition stage is considered highly important. The "Thinking" phase shows a more dynamic pattern, with an initial decrease in importance followed by fluctuations. The mean score and ratio provide a baseline for understanding the average importance during the "Thinking" phase. The spikes in the "Thinking" phase could represent key moments or insights during the reasoning process. The increase in "Importance Score" towards the end of the "Thinking" phase might indicate a final push or realization.