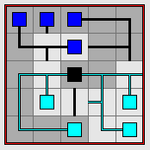
## Diagram: Network Flow Schematic
### Overview
The image displays a schematic diagram on an 8x8 grid background. It depicts two distinct networks of colored square nodes connected by lines, converging at a central black node. The diagram appears to represent a logical or physical flow, possibly a circuit, data flow, or organizational chart. There is no embedded text, labels, or numerical data within the image.
### Components/Axes
* **Grid:** An 8x8 grid of light gray squares forms the background canvas.
* **Nodes:** There are three types of square nodes:
* **Blue Nodes:** 5 solid blue squares.
* **Cyan Nodes:** 4 solid cyan (light blue) squares.
* **Black Node:** 1 solid black square.
* **Connections (Edges):** Lines connect the nodes.
* **Black Lines:** Connect the blue nodes and the black node.
* **Teal Lines:** Connect the cyan nodes and the black node.
* **Legend:** No explicit legend is present. Color and line style are the primary differentiators.
### Detailed Analysis
**Spatial Grounding & Component Isolation:**
* **Header Region (Top 4 rows):**
* Contains all 5 **Blue Nodes**.
* They are interconnected via a network of **black lines**.
* The connections form a branching structure. One blue node (row 2, column 3) acts as a local hub, connecting to three other blue nodes and also sending a single black line down to the central black node.
* The blue network is primarily located in the top-left quadrant of the grid.
* **Central Junction:**
* A single **Black Node** is positioned at the grid intersection of row 5, column 4 (counting from top-left).
* It receives one black line from the blue network above.
* It receives one teal line from the cyan network below.
* It acts as the sole connection point between the two colored networks.
* **Footer Region (Bottom 4 rows):**
* Contains all 4 **Cyan Nodes**.
* They are interconnected via a network of **teal lines**.
* The connections form a more linear, daisy-chained structure compared to the blue network. The teal lines run along the grid lines, creating right-angle paths.
* The cyan network is primarily located in the bottom-right quadrant of the grid.
**Flow Direction Inference:**
While arrows are not present, the topology suggests a potential flow:
1. Information or material originates in the distributed **blue network**.
2. It is aggregated or processed through the blue network's internal connections.
3. It flows down a single path to the central **black node**.
4. From the black node, it is distributed into the **cyan network** via a single path, which then propagates through the cyan nodes.
### Key Observations
1. **Asymmetry:** The two networks are not symmetrical. The blue network has more nodes (5 vs. 4) and a more complex, branched interconnection pattern. The cyan network is more linear.
2. **Central Bottleneck:** All interaction between the two distinct systems (blue and cyan) is forced through a single point—the black node. This represents a critical point of failure or control.
3. **Color-Coded Systems:** The use of distinct colors (blue/teal) for nodes and their corresponding connection lines clearly demarcates two separate subsystems or domains.
4. **Grid-Based Layout:** The placement of nodes appears deliberate on the grid, suggesting the spatial arrangement may be significant (e.g., representing physical location, logical hierarchy, or stages in a process).
### Interpretation
This diagram is a **Peircean diagram of a relational system**. It visually argues that two complex, internally connected systems (the blue and cyan networks) are fundamentally separate but can interact through a defined, singular interface (the black node).
* **What it demonstrates:** It models a common architectural pattern: **modularity with a controlled interface**. The blue and cyan clusters represent independent modules with high internal cohesion. The black node is the API, gateway, or mediator that allows limited, structured communication between them.
* **Why it matters:** This pattern is fundamental in engineering (microservices, integrated circuits), biology (neural pathways, organ systems), and organizational design (departmental silos with a liaison). The diagram highlights both the strength (isolation, independence) and the vulnerability (single point of failure) of such a design.
* **Notable Anomaly:** The complete lack of labels is the most significant feature. It renders the diagram purely abstract. Its meaning is entirely dependent on the context in which it is presented. It is a template for a relationship, not a description of a specific one. The viewer must supply the identity of the nodes and the nature of the flow.