\n
## Bar Chart: Accuracy Comparison - Raw vs. Processed
### Overview
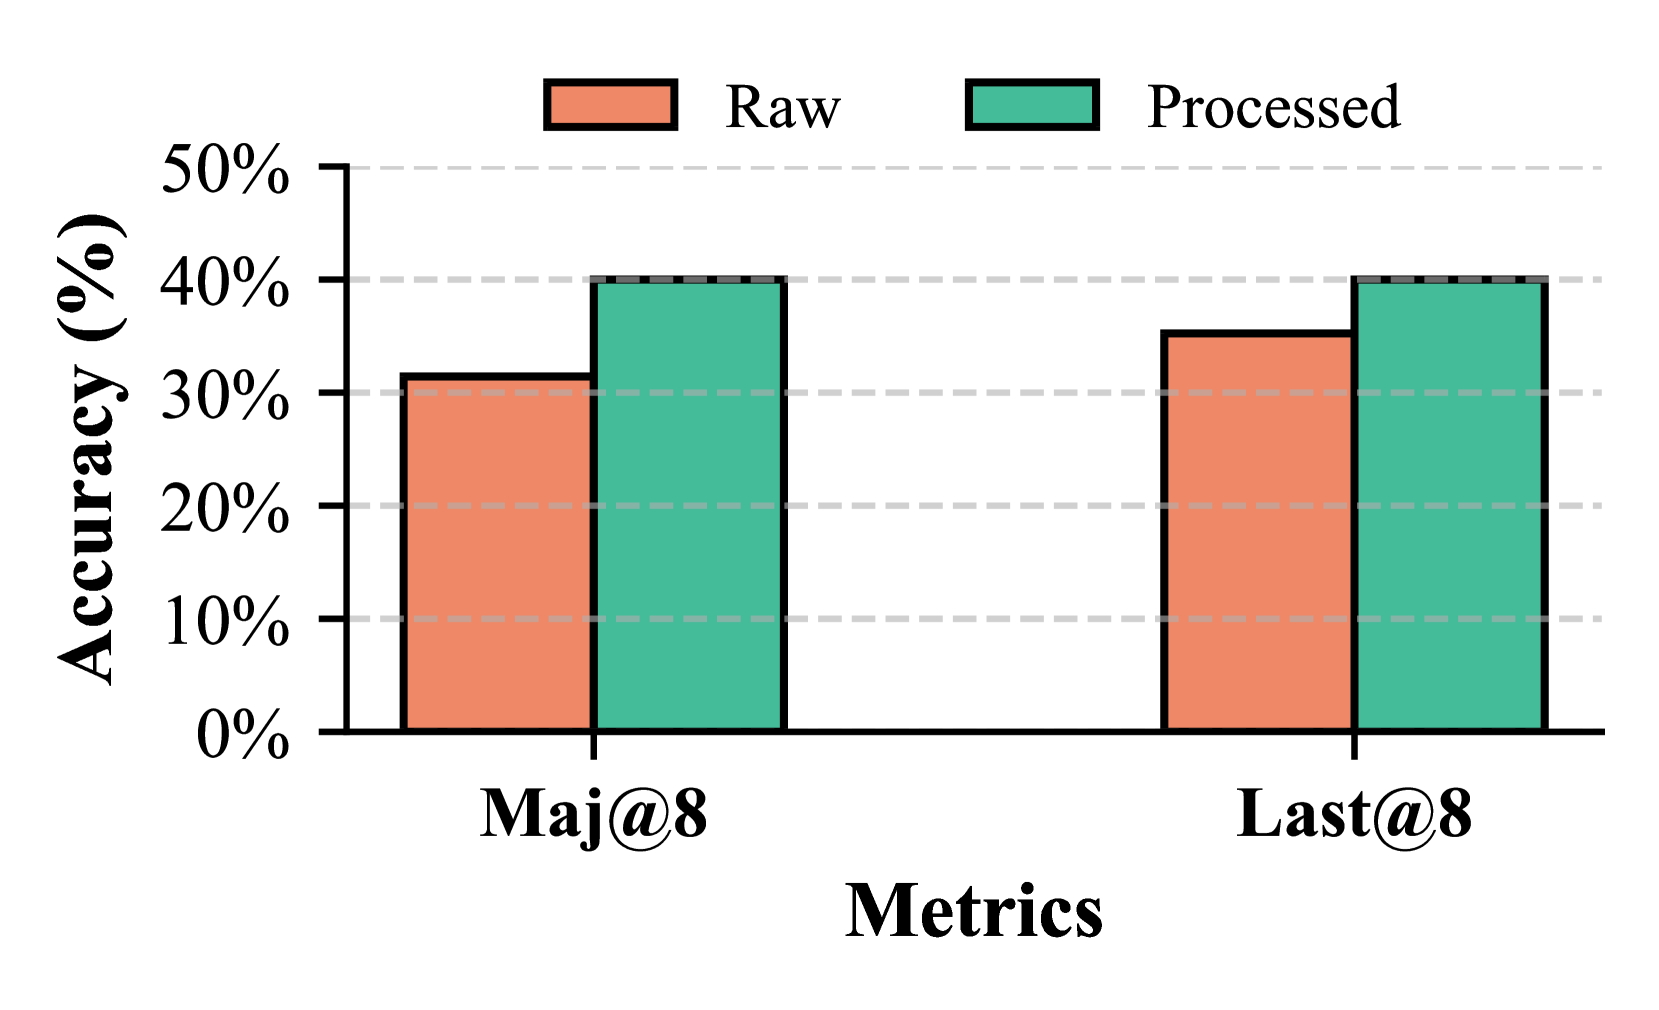
This bar chart compares the accuracy of "Raw" and "Processed" data across two metrics: "Maj@8" and "Last@8". Accuracy is measured in percentage (%). The chart consists of two sets of paired bars, one for each metric, representing the accuracy of the Raw and Processed data.
### Components/Axes
* **X-axis:** "Metrics" with two categories: "Maj@8" and "Last@8".
* **Y-axis:** "Accuracy (%)" ranging from 0% to 50%, with tick marks at 0%, 10%, 20%, 30%, 40%, and 50%.
* **Legend:** Located at the top-center of the chart.
* "Raw" - represented by a reddish-orange color.
* "Processed" - represented by a teal color.
### Detailed Analysis
**Maj@8:**
* The "Raw" bar for "Maj@8" reaches approximately 30% accuracy.
* The "Processed" bar for "Maj@8" reaches approximately 40% accuracy.
* The "Processed" bar is visually taller than the "Raw" bar, indicating higher accuracy.
**Last@8:**
* The "Raw" bar for "Last@8" reaches approximately 34% accuracy.
* The "Processed" bar for "Last@8" reaches approximately 42% accuracy.
* The "Processed" bar is visually taller than the "Raw" bar, indicating higher accuracy.
### Key Observations
* The "Processed" data consistently outperforms the "Raw" data for both metrics.
* The difference in accuracy between "Raw" and "Processed" is slightly larger for "Maj@8" than for "Last@8".
* Both metrics show accuracy values below 50%.
### Interpretation
The chart demonstrates that the processing step significantly improves accuracy for both "Maj@8" and "Last@8" metrics. This suggests that the processing method effectively refines the data, leading to more accurate results. The slightly larger improvement in "Maj@8" could indicate that the processing is particularly beneficial for this specific metric, or that the raw data for "Maj@8" was initially less accurate. The fact that both metrics remain below 50% suggests there is still room for improvement, even with the processing applied. The chart implies that the processing step is a valuable component of the overall system, but further optimization may be necessary to achieve higher accuracy levels.