## Box Plot: Comparison of Mean Square Error (MSE) and Hybrid Loss for BAST-NSP and BAST-SP Models
### Overview
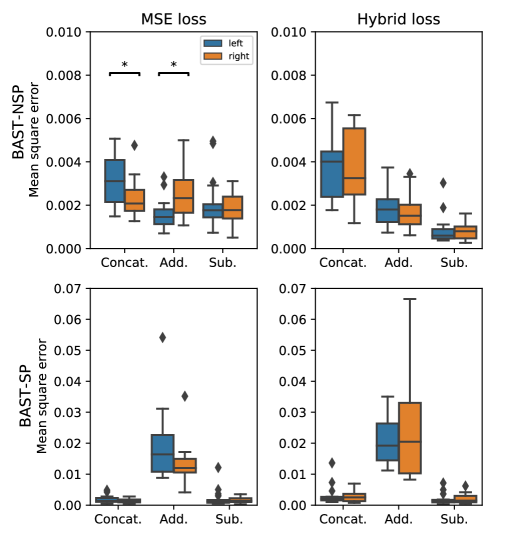
The image contains four box plots comparing the **mean square error (MSE)** and **hybrid loss** for two models: **BAST-NSP** and **BAST-SP**. Each plot evaluates three methods: **Concat**, **Add**, and **Sub**. The y-axis represents the mean square error, while the x-axis categorizes the methods. Legends indicate "left" (blue) and "right" (orange) data splits, with asterisks (*) denoting statistical significance.
---
### Components/Axes
- **X-axis**: Methods (Concat, Add, Sub)
- **Y-axis**: Mean square error (ranging from 0.00 to 0.07)
- **Legends**:
- Blue: "left"
- Orange: "right"
- **Titles**:
- Top-left: "MSE loss"
- Top-right: "Hybrid loss"
- Bottom-left: "BAST-NSP"
- Bottom-right: "BAST-SP"
---
### Detailed Analysis
#### BAST-NSP (MSE loss)
- **Concat**: Median ~0.02, range 0.01–0.04
- **Add**: Median ~0.03, range 0.02–0.05
- **Sub**: Median ~0.01, range 0.005–0.02
- **Hybrid loss**:
- **Concat**: Median ~0.04, range 0.03–0.06
- **Add**: Median ~0.03, range 0.02–0.05
- **Sub**: Median ~0.02, range 0.01–0.03
#### BAST-SP (MSE loss)
- **Concat**: Median ~0.01, range 0.005–0.02
- **Add**: Median ~0.02, range 0.01–0.03
- **Sub**: Median ~0.005, range 0.002–0.01
- **Hybrid loss**:
- **Concat**: Median ~0.005, range 0.003–0.01
- **Add**: Median ~0.01, range 0.005–0.02
- **Sub**: Median ~0.003, range 0.001–0.005
**Asterisks (*)**: Indicate statistical significance (e.g., *p < 0.05*) for differences between methods.
---
### Key Observations
1. **BAST-SP outperforms BAST-NSP** in both MSE and hybrid loss across all methods, with lower median values.
2. **Add method** consistently shows higher error rates than **Concat** and **Sub** in both models.
3. **Hybrid loss** generally has higher error values than **MSE loss** for both models.
4. **Statistical significance** is marked for the **Add method** in BAST-NSP (MSE loss) and **Concat** in BAST-SP (hybrid loss).
---
### Interpretation
- The **BAST-SP model** demonstrates superior performance, likely due to architectural or training improvements.
- The **Add method** introduces higher error, suggesting potential instability or overfitting in this configuration.
- **Hybrid loss** may reflect a trade-off between model complexity and generalization, as it shows higher variability.
- The **asterisks** highlight critical differences, emphasizing the importance of method selection in model design.
This analysis underscores the need to optimize both model architecture (e.g., BAST-SP vs. BAST-NSP) and method selection (e.g., avoiding the Add method) to minimize error.