## Chart: Mistral-7B Model Performance Comparison
### Overview
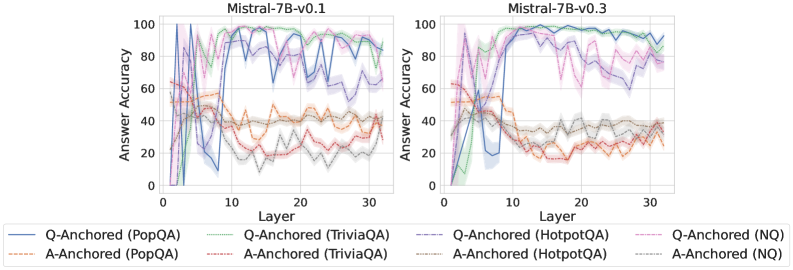
The image presents two line charts comparing the answer accuracy of Mistral-7B models (v0.1 and v0.3) across different layers and question-answering datasets. The charts display the performance of question-anchored (Q-Anchored) and answer-anchored (A-Anchored) approaches on PopQA, TriviaQA, HotpotQA, and NQ datasets. The x-axis represents the layer number, and the y-axis represents the answer accuracy.
### Components/Axes
* **Titles:**
* Left Chart: "Mistral-7B-v0.1"
* Right Chart: "Mistral-7B-v0.3"
* **Y-Axis:**
* Label: "Answer Accuracy"
* Scale: 0 to 100, with tick marks at 0, 20, 40, 60, 80, and 100.
* **X-Axis:**
* Label: "Layer"
* Scale: 0 to 30, with tick marks every 10 units.
* **Legend:** Located at the bottom of the image.
* Q-Anchored (PopQA): Solid Blue Line
* A-Anchored (PopQA): Dashed Brown Line
* Q-Anchored (TriviaQA): Dotted Green Line
* A-Anchored (TriviaQA): Dash-Dotted Red Line
* Q-Anchored (HotpotQA): Dash-Dot-Dotted Purple Line
* A-Anchored (HotpotQA): Dotted Orange Line
* Q-Anchored (NQ): Dashed Pink Line
* A-Anchored (NQ): Dash-Dotted Gray Line
### Detailed Analysis
**Left Chart: Mistral-7B-v0.1**
* **Q-Anchored (PopQA):** (Solid Blue Line) Starts at approximately 0% accuracy, rapidly increases to around 90-100% by layer 10, and then fluctuates between 70% and 100% for the remaining layers.
* **A-Anchored (PopQA):** (Dashed Brown Line) Starts around 50% accuracy, decreases to around 30-40% by layer 10, and then fluctuates between 30% and 50% for the remaining layers.
* **Q-Anchored (TriviaQA):** (Dotted Green Line) Starts around 60% accuracy, increases to around 90% by layer 10, and then fluctuates between 80% and 100% for the remaining layers.
* **A-Anchored (TriviaQA):** (Dash-Dotted Red Line) Starts around 50% accuracy, decreases to around 20% by layer 10, and then fluctuates between 20% and 40% for the remaining layers.
* **Q-Anchored (HotpotQA):** (Dash-Dot-Dotted Purple Line) Starts around 60% accuracy, increases to around 90% by layer 10, and then fluctuates between 70% and 90% for the remaining layers.
* **A-Anchored (HotpotQA):** (Dotted Orange Line) Starts around 50% accuracy, decreases to around 30% by layer 10, and then fluctuates between 30% and 40% for the remaining layers.
* **Q-Anchored (NQ):** (Dashed Pink Line) Starts around 60% accuracy, fluctuates significantly, and then stabilizes around 70-80% after layer 10.
* **A-Anchored (NQ):** (Dash-Dotted Gray Line) Starts around 40% accuracy, decreases to around 20% by layer 10, and then fluctuates between 20% and 40% for the remaining layers.
**Right Chart: Mistral-7B-v0.3**
* **Q-Anchored (PopQA):** (Solid Blue Line) Starts at approximately 0% accuracy, rapidly increases to around 90-100% by layer 10, and then fluctuates between 90% and 100% for the remaining layers.
* **A-Anchored (PopQA):** (Dashed Brown Line) Starts around 50% accuracy, decreases to around 30% by layer 10, and then fluctuates between 20% and 40% for the remaining layers.
* **Q-Anchored (TriviaQA):** (Dotted Green Line) Starts around 20% accuracy, increases to around 90% by layer 10, and then fluctuates between 80% and 100% for the remaining layers.
* **A-Anchored (TriviaQA):** (Dash-Dotted Red Line) Starts around 50% accuracy, decreases to around 20% by layer 10, and then fluctuates between 20% and 30% for the remaining layers.
* **Q-Anchored (HotpotQA):** (Dash-Dot-Dotted Purple Line) Starts around 60% accuracy, increases to around 90% by layer 10, and then fluctuates between 70% and 90% for the remaining layers.
* **A-Anchored (HotpotQA):** (Dotted Orange Line) Starts around 50% accuracy, decreases to around 20% by layer 10, and then fluctuates between 20% and 30% for the remaining layers.
* **Q-Anchored (NQ):** (Dashed Pink Line) Starts around 60% accuracy, fluctuates significantly, and then stabilizes around 70-80% after layer 10.
* **A-Anchored (NQ):** (Dash-Dotted Gray Line) Starts around 40% accuracy, decreases to around 20% by layer 10, and then fluctuates between 20% and 30% for the remaining layers.
### Key Observations
* For both model versions, Q-Anchored approaches generally outperform A-Anchored approaches across all datasets.
* PopQA, TriviaQA, HotpotQA datasets show a significant increase in accuracy for Q-Anchored approaches within the first 10 layers.
* A-Anchored approaches generally show a decrease in accuracy within the first 10 layers and then stabilize.
* The shaded regions around each line indicate the variance or uncertainty in the accuracy measurements.
* The performance of Q-Anchored (PopQA) and Q-Anchored (TriviaQA) is very high, reaching nearly 100% accuracy in later layers for both model versions.
### Interpretation
The data suggests that question-anchoring is a more effective strategy than answer-anchoring for these models and datasets. The rapid increase in accuracy for Q-Anchored approaches in the early layers indicates that the model quickly learns to extract relevant information from the questions. The relatively poor performance of A-Anchored approaches suggests that the model struggles to effectively utilize information from the answers alone. The high accuracy achieved by Q-Anchored (PopQA) and Q-Anchored (TriviaQA) indicates that these datasets may be relatively easier for the model to solve compared to HotpotQA and NQ. The comparison between Mistral-7B-v0.1 and Mistral-7B-v0.3 shows that the later version generally maintains or slightly improves the performance across all datasets and anchoring methods.