## Diagram: Network Topology with Annotated Connections
### Overview
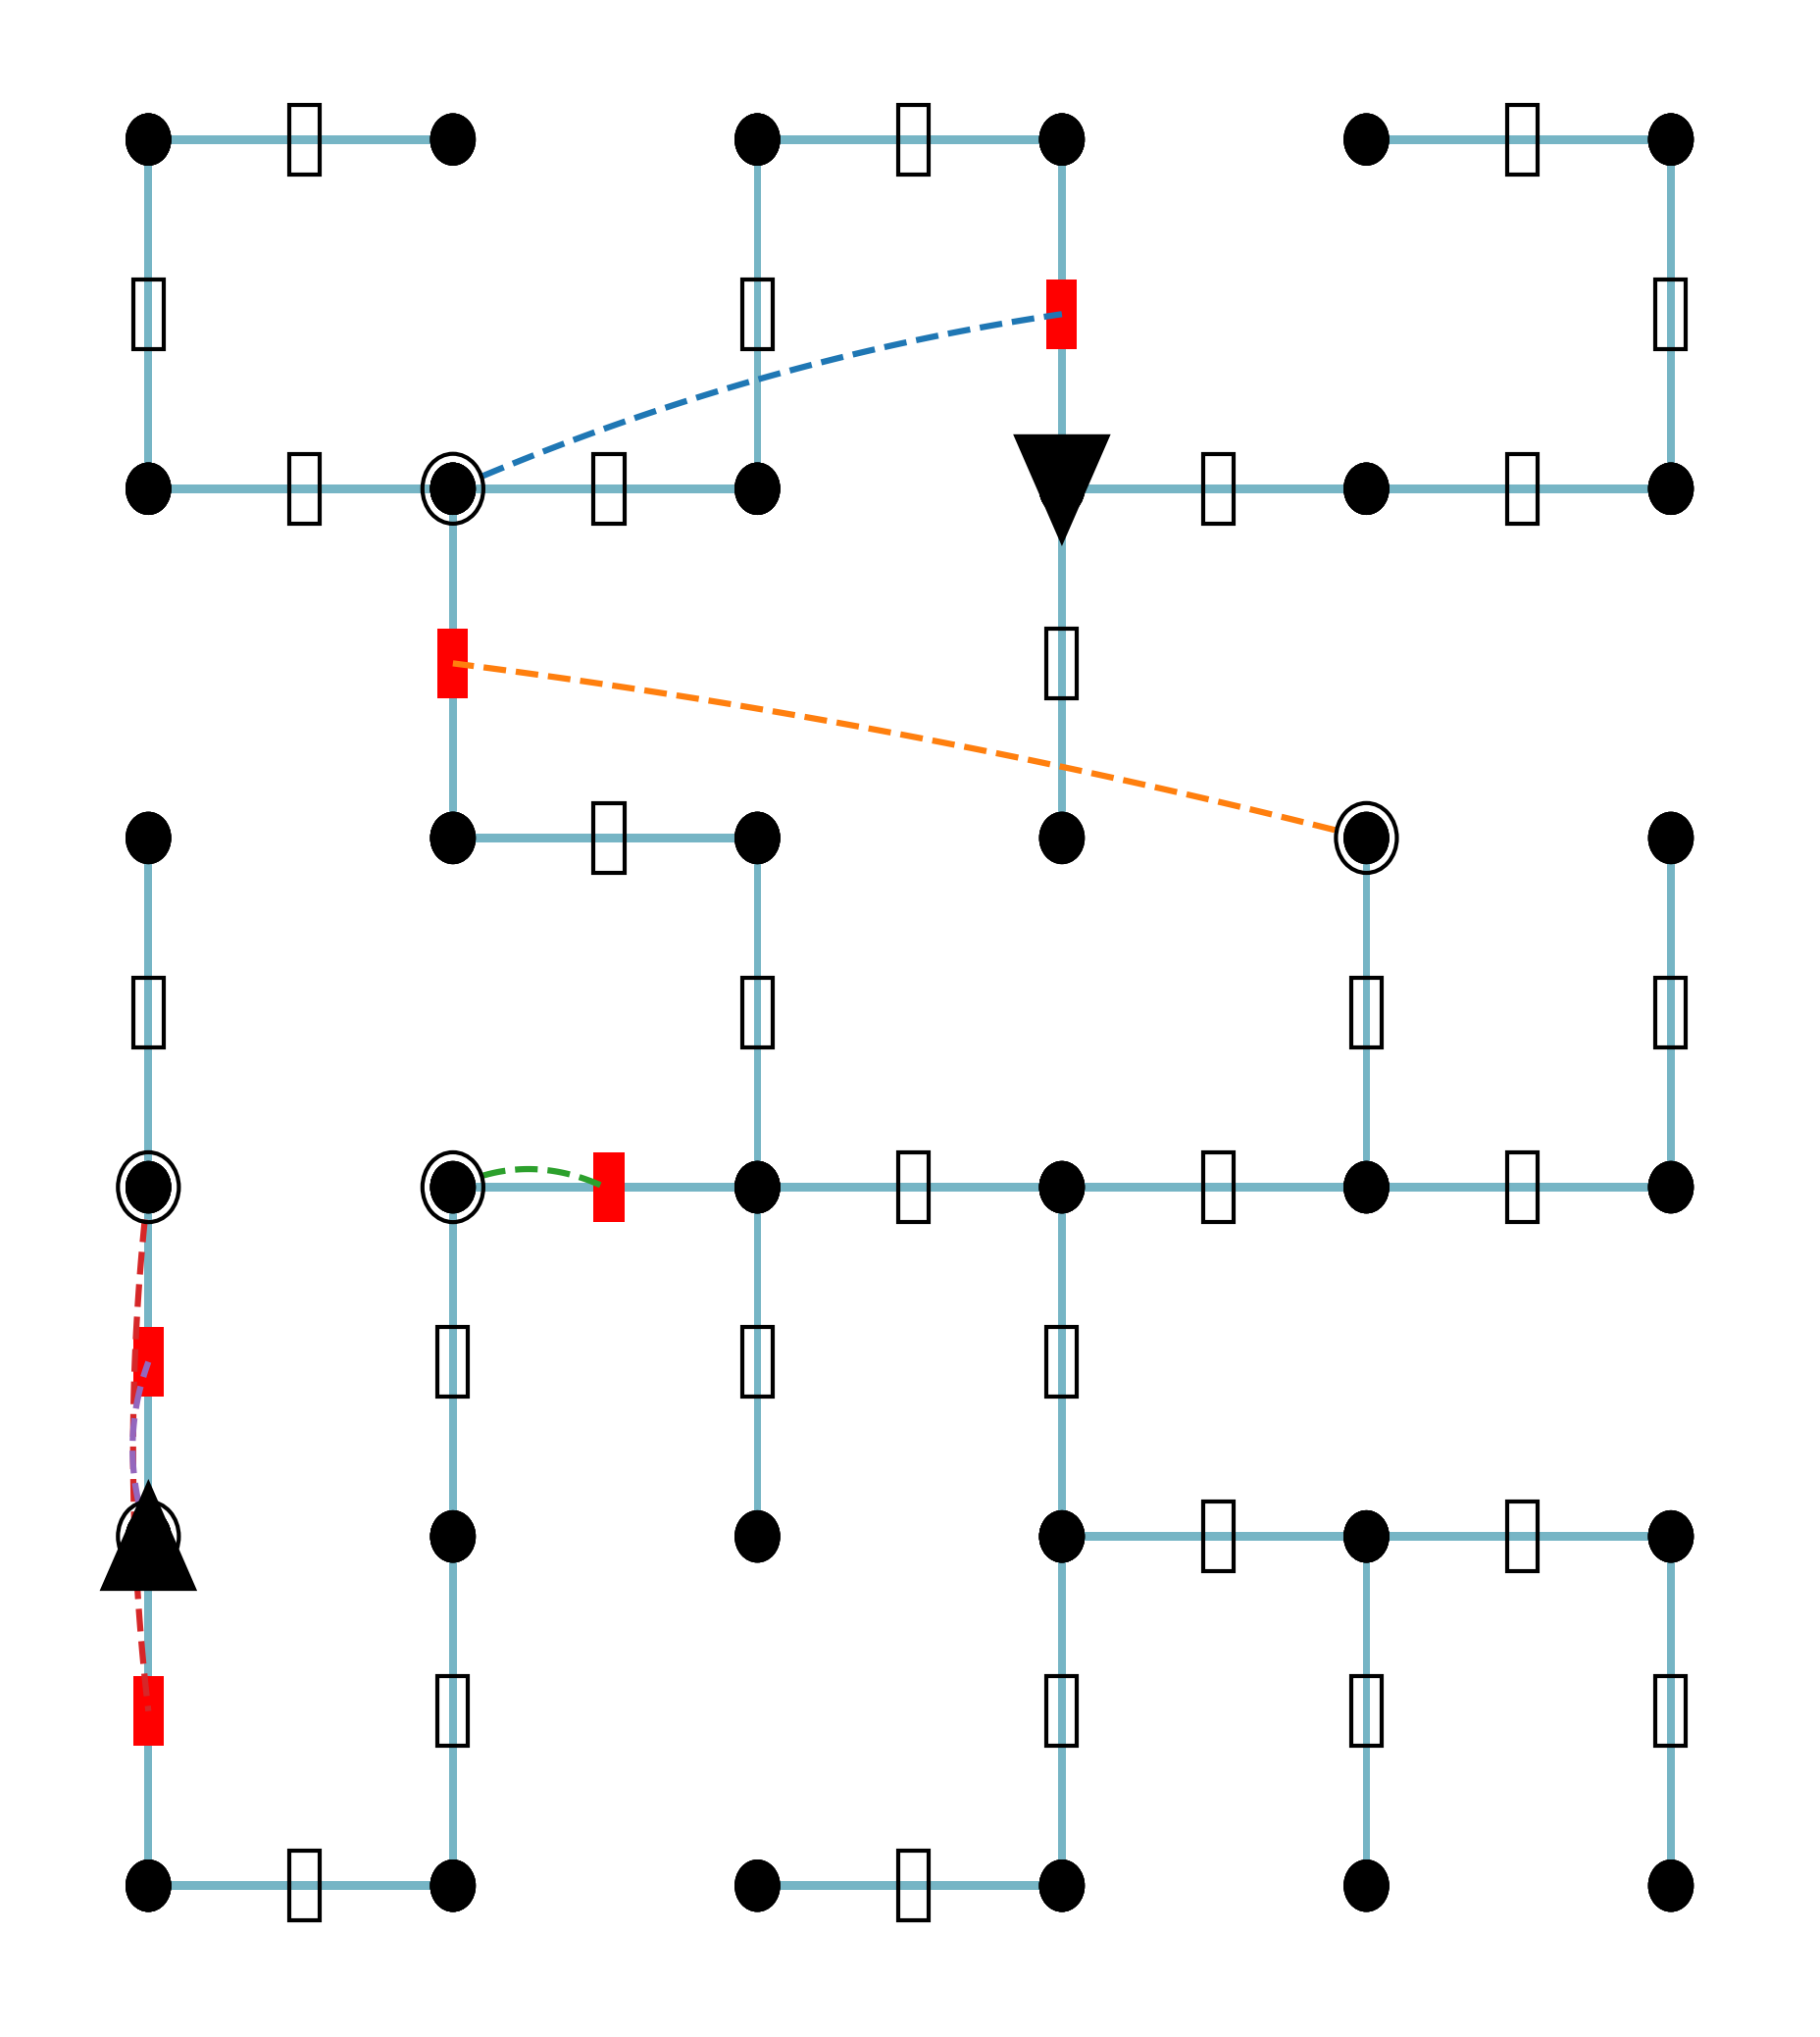
The image displays a schematic diagram of a network or grid-based system. It consists of nodes (represented by circles and triangles) connected by lines (edges) in a structured, grid-like layout. The diagram includes annotations in the form of colored dashed lines and highlighted components (red rectangles), suggesting specific relationships, paths, or states within the network. There is no textual information, labels, axes, or legends present in the image.
### Components/Layout
The diagram is organized on an implicit 5x5 grid, though not all grid intersections are occupied. The primary components are:
#### 1. Nodes
| Node Type | Description | Instances & Locations |
| :--- | :--- | :--- |
| **Solid Black Circles** | The most common node type. | Numerous grid intersections. |
| **Circles with a Black Ring (Hollow Center)** | A distinct node type. | Four instances: <br>• Top-left quadrant (row 2, column 2). <br>• Middle-left area (row 4, column 1). <br>• Center-left area (row 4, column 2). <br>• Middle-right area (row 3, column 4). |
| **Solid Black Triangles** | Pointing downwards. | Two instances: <br>• Upper-right quadrant (row 2, column 3). <br>• Lower-left quadrant (row 4, column 1), overlapping with a ringed circle. |
#### 2. Connections (Edges)
| Connection Type | Description | Details |
| :--- | :--- | :--- |
| **Solid Blue Lines** | Form the primary grid structure. | Connect adjacent nodes horizontally and vertically. |
| **Rectangular Elements on Blue Lines** | Small, empty white rectangles centered on most blue lines. | Likely represent standard components, links, or relays. |
| **Red Rectangles** | Some rectangles on the blue lines are filled with solid red. | Appear at specific locations, potentially indicating a fault, a special component, or an active state. **Total: 5 instances.** |
#### 3. Annotated Paths (Dashed Lines)
| Path Color | Connection | Description |
| :--- | :--- | :--- |
| **Blue Dashed Line** | Connects a ringed circle (top-left) to a red rectangle (upper-middle). | |
| **Orange Dashed Line** | Connects a red rectangle (middle-left) to a ringed circle (middle-right). | |
| **Green Dashed Line** | Connects a ringed circle (center-left) to a red rectangle (center). | |
| **Purple/Red Dashed Line** | Connects a ringed circle (middle-left) to a red rectangle (lower-left). | Passes through a triangle node. |
### Detailed Analysis
* **Spatial Distribution:** The network is denser in the central and right portions. The left column has a distinct vertical chain of nodes (including two ringed circles and a triangle) connected by a blue line with three red rectangles.
* **Node Relationships:** The ringed circles and triangles appear to be key junction points or special nodes. All annotated dashed lines originate from or connect to these special nodes.
* **Pattern of Red Rectangles:** The red rectangles are not randomly placed. They are all located on vertical blue line segments. Three are in the leftmost column, one is in the upper-middle, and one is in the center.
### Key Observations
1. **Special Node Clustering:** The ringed circles and triangles are not isolated; they are connected via the annotated dashed paths, suggesting a secondary layer of relationship or communication over the primary grid.
2. **Fault/State Indication:** The consistent use of red rectangles on specific vertical links, especially the concentration in the left column, strongly implies these represent a common condition—possibly faults, congested links, or components under specific test.
3. **Path Redundancy:** The dashed lines create alternative paths between special nodes that do not follow the direct grid connections. For example, the orange dashed line provides a direct link between the middle-left and middle-right areas, bypassing several grid hops.
### Interpretation
This diagram is a technical schematic, likely representing:
* A **power distribution grid** or **communication network topology**.
* A **state diagram** for a system, where nodes are states and lines are transitions.
* A **fault analysis map**, where red rectangles indicate failed components and dashed lines show rerouted paths or diagnostic connections.
The visual evidence suggests a system with a regular physical or logical structure (the blue grid) overlaid with a layer of monitoring, control, or fault management (the special nodes and dashed annotations). The left column's vertical chain with multiple red rectangles could indicate a critical path or a subsystem experiencing multiple issues. The dashed lines demonstrate how the system might be reconfigured or how information flows between key control points (ringed circles/triangles) to manage the state of the network. The absence of text implies this is a conceptual or internal diagram where the symbology is standardized for its intended audience.