# Technical Diagram Analysis: Transformer Attention Mechanisms
This document provides a detailed technical extraction of the provided image, which illustrates two different computational flows within a Large Language Model (LLM) architecture, specifically focusing on how tokens interact during processing.
## 1. Component Identification
The image consists of two side-by-side diagrams (Left and Right) sharing a common visual language.
### Visual Legend & Symbols
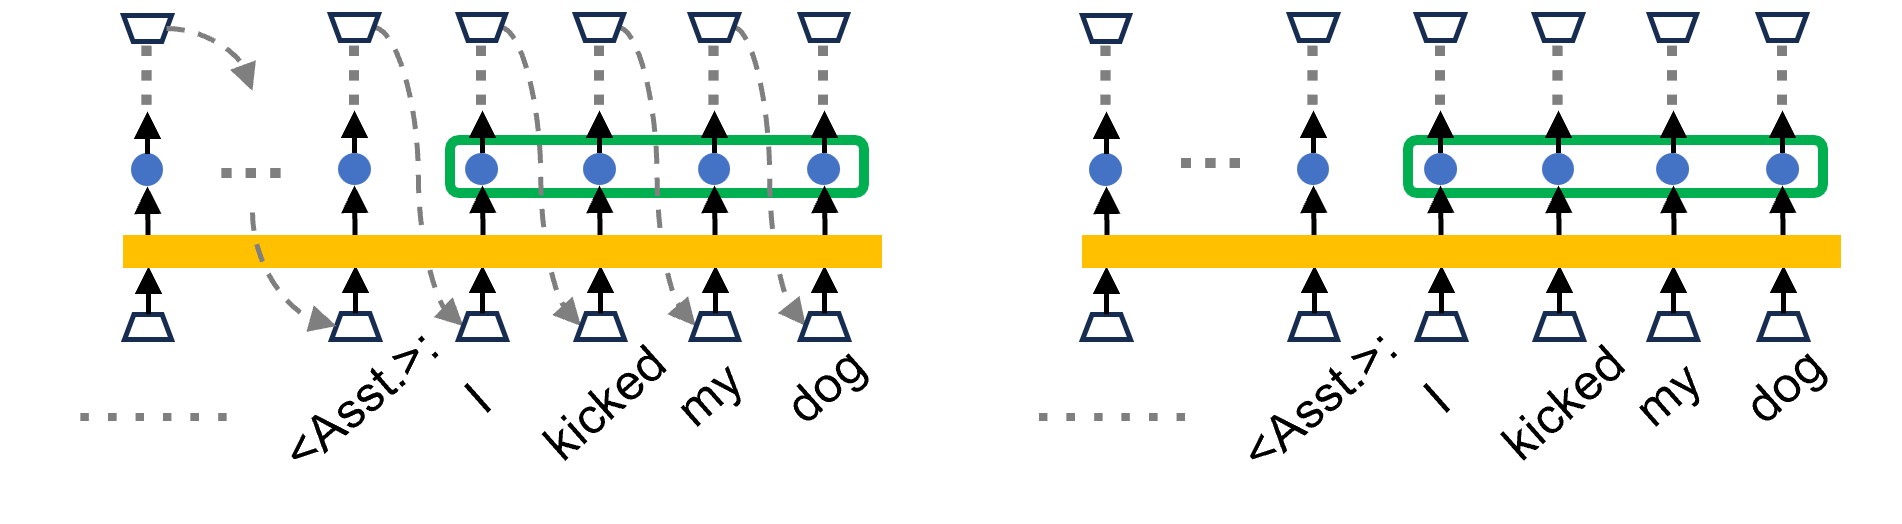
* **Trapezoids (Bottom):** Represent input embedding layers or token entry points.
* **Trapezoids (Top):** Represent output layers or prediction heads.
* **Solid Black Arrows:** Indicate the vertical flow of data through the model layers.
* **Yellow Horizontal Bar:** Represents a shared processing layer (likely a Transformer block or Attention mechanism).
* **Blue Circles:** Represent hidden states or activations at a specific layer.
* **Green Rounded Rectangle:** Groups a sequence of blue hidden states, indicating a collective operation or a "window" of interest.
* **Dashed Grey Arrows (Left Diagram only):** Represent causal dependencies or "look-back" mechanisms where an output at time $t$ influences an input at time $t+1$.
* **Dotted Grey Vertical Lines:** Indicate connections to higher layers not explicitly shown.
* **Horizontal Dotted Grey Lines:** Indicate a continuation of the sequence (ellipsis).
---
## 2. Textual Content Extraction
The text at the bottom of both diagrams represents a tokenized sequence.
| Token Index | Text Label | Notes |
| :--- | :--- | :--- |
| 1 | `......` | Ellipsis indicating preceding context. |
| 2 | `<Asst.>` | Special token indicating the start of an Assistant response. |
| 3 | `I` | First word of the sentence. |
| 4 | `kicked` | Second word of the sentence. |
| 5 | `my` | Third word of the sentence. |
| 6 | `dog` | Fourth word of the sentence. |
---
## 3. Diagram Analysis & Comparison
### Region 1: Left Diagram (Autoregressive / Training Flow)
* **Trend:** This diagram shows a sequential dependency.
* **Flow Description:**
* Data moves from the bottom trapezoids, through the yellow bar, to the blue hidden states.
* **Causal Links:** Dashed grey arrows originate from the top output trapezoids and point back down to the input trapezoids of the *subsequent* token.
* **Specific Mapping:**
* The output of `<Asst.>` points to the input of `I`.
* The output of `I` points to the input of `kicked`.
* The output of `kicked` points to the input of `my`.
* The output of `my` points to the input of `dog`.
* **Grouping:** The green box highlights the blue hidden states for the tokens `I`, `kicked`, `my`, and `dog`.
### Region 2: Right Diagram (Parallel / Inference Flow)
* **Trend:** This diagram shows independent vertical processing without the explicit feedback loops shown on the left.
* **Flow Description:**
* The vertical flow from input trapezoid $\rightarrow$ yellow bar $\rightarrow$ blue circle $\rightarrow$ output trapezoid remains identical to the left diagram.
* **Key Difference:** The dashed grey "feedback" arrows are entirely absent. This suggests a state where the model is processing the entire sequence in parallel (as in training with teacher forcing) or is focusing on the internal representations (KV caching context) rather than the step-by-step generation.
* **Grouping:** The green box remains around the same four tokens (`I`, `kicked`, `my`, `dog`), emphasizing that the internal states are the focus of the comparison.
---
## 4. Technical Summary
The image contrasts **Autoregressive Generation** (Left) with **Parallel Processing/Representation** (Right).
1. **Left Side:** Illustrates the "Next Token Prediction" loop. The model uses its own previous output as the next input to generate the sequence "I kicked my dog".
2. **Right Side:** Illustrates the static representation of that same sequence. The green box likely highlights a specific "Activation" or "KV Cache" segment that is being analyzed or modified (potentially for techniques like Activation Steering or Model Editing).