TECHNICAL ASSET FINGERPRINT
3a89013f775a57388eab856d
Click to view fullscreen
Press ESC or click to close
FOUND IN PAPERS
EXPERT: gemini-2.0-flash VERSION 1
RUNTIME: nugit/gemini/gemini-2.0-flash
INTEL_VERIFIED
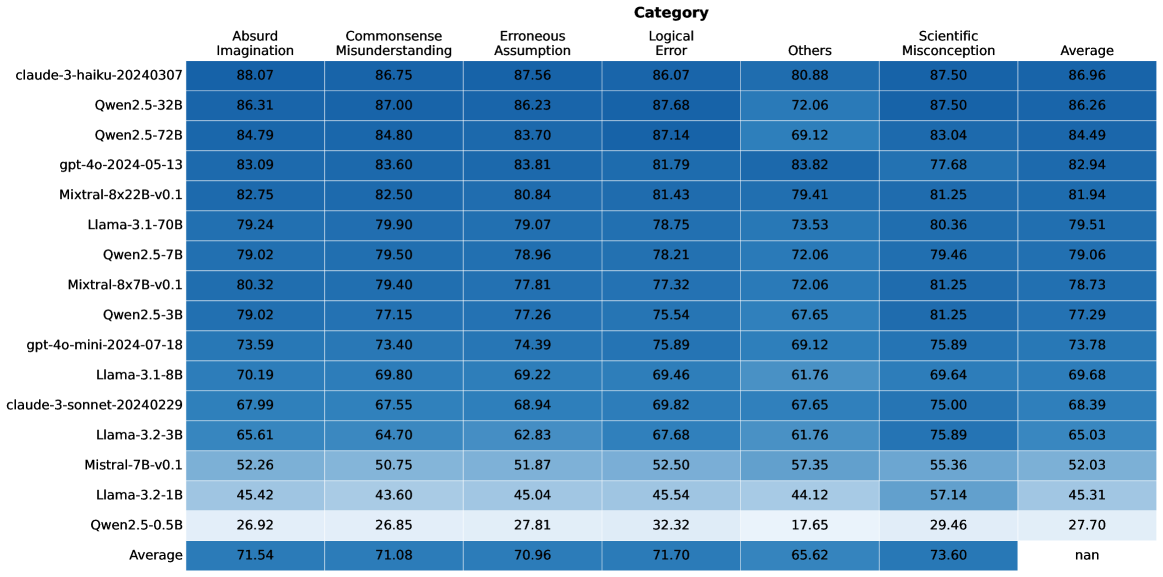
## Heatmap: Model Performance Across Error Categories
### Overview
The image is a heatmap displaying the performance of various language models across different error categories. The rows represent the models, and the columns represent the error categories and the average performance. The cells are color-coded, presumably based on the performance score, though the color scale is not explicitly provided.
### Components/Axes
* **Rows (Models):**
* claude-3-haiku-20240307
* Qwen2.5-32B
* Qwen2.5-72B
* gpt-4o-2024-05-13
* Mixtral-8x22B-v0.1
* Llama-3.1-70B
* Qwen2.5-7B
* Mixtral-8x7B-v0.1
* Qwen2.5-3B
* gpt-4o-mini-2024-07-18
* Llama-3.1-8B
* claude-3-sonnet-20240229
* Llama-3.2-3B
* Mistral-7B-v0.1
* Llama-3.2-1B
* Qwen2.5-0.5B
* Average
* **Columns (Categories):**
* Absurd Imagination
* Commonsense Misunderstanding
* Erroneous Assumption
* Logical Error
* Others
* Scientific Misconception
* Average
### Detailed Analysis or ### Content Details
Here's a breakdown of the data for each model and category:
* **claude-3-haiku-20240307:**
* Absurd Imagination: 88.07
* Commonsense Misunderstanding: 86.75
* Erroneous Assumption: 87.56
* Logical Error: 86.07
* Others: 80.88
* Scientific Misconception: 87.50
* Average: 86.96
* **Qwen2.5-32B:**
* Absurd Imagination: 86.31
* Commonsense Misunderstanding: 87.00
* Erroneous Assumption: 86.23
* Logical Error: 87.68
* Others: 72.06
* Scientific Misconception: 87.50
* Average: 86.26
* **Qwen2.5-72B:**
* Absurd Imagination: 84.79
* Commonsense Misunderstanding: 84.80
* Erroneous Assumption: 83.70
* Logical Error: 87.14
* Others: 69.12
* Scientific Misconception: 83.04
* Average: 84.49
* **gpt-4o-2024-05-13:**
* Absurd Imagination: 83.09
* Commonsense Misunderstanding: 83.60
* Erroneous Assumption: 83.81
* Logical Error: 81.79
* Others: 83.82
* Scientific Misconception: 77.68
* Average: 82.94
* **Mixtral-8x22B-v0.1:**
* Absurd Imagination: 82.75
* Commonsense Misunderstanding: 82.50
* Erroneous Assumption: 80.84
* Logical Error: 81.43
* Others: 79.41
* Scientific Misconception: 81.25
* Average: 81.94
* **Llama-3.1-70B:**
* Absurd Imagination: 79.24
* Commonsense Misunderstanding: 79.90
* Erroneous Assumption: 79.07
* Logical Error: 78.75
* Others: 73.53
* Scientific Misconception: 80.36
* Average: 79.51
* **Qwen2.5-7B:**
* Absurd Imagination: 79.02
* Commonsense Misunderstanding: 79.50
* Erroneous Assumption: 78.96
* Logical Error: 78.21
* Others: 72.06
* Scientific Misconception: 79.46
* Average: 79.06
* **Mixtral-8x7B-v0.1:**
* Absurd Imagination: 80.32
* Commonsense Misunderstanding: 79.40
* Erroneous Assumption: 77.81
* Logical Error: 77.32
* Others: 72.06
* Scientific Misconception: 81.25
* Average: 78.73
* **Qwen2.5-3B:**
* Absurd Imagination: 79.02
* Commonsense Misunderstanding: 77.15
* Erroneous Assumption: 77.26
* Logical Error: 75.54
* Others: 67.65
* Scientific Misconception: 81.25
* Average: 77.29
* **gpt-4o-mini-2024-07-18:**
* Absurd Imagination: 73.59
* Commonsense Misunderstanding: 73.40
* Erroneous Assumption: 74.39
* Logical Error: 75.89
* Others: 69.12
* Scientific Misconception: 75.89
* Average: 73.78
* **Llama-3.1-8B:**
* Absurd Imagination: 70.19
* Commonsense Misunderstanding: 69.80
* Erroneous Assumption: 69.22
* Logical Error: 69.46
* Others: 61.76
* Scientific Misconception: 69.64
* Average: 69.68
* **claude-3-sonnet-20240229:**
* Absurd Imagination: 67.99
* Commonsense Misunderstanding: 67.55
* Erroneous Assumption: 68.94
* Logical Error: 69.82
* Others: 67.65
* Scientific Misconception: 75.00
* Average: 68.39
* **Llama-3.2-3B:**
* Absurd Imagination: 65.61
* Commonsense Misunderstanding: 64.70
* Erroneous Assumption: 62.83
* Logical Error: 67.68
* Others: 61.76
* Scientific Misconception: 75.89
* Average: 65.03
* **Mistral-7B-v0.1:**
* Absurd Imagination: 52.26
* Commonsense Misunderstanding: 50.75
* Erroneous Assumption: 51.87
* Logical Error: 52.50
* Others: 57.35
* Scientific Misconception: 55.36
* Average: 52.03
* **Llama-3.2-1B:**
* Absurd Imagination: 45.42
* Commonsense Misunderstanding: 43.60
* Erroneous Assumption: 45.04
* Logical Error: 45.54
* Others: 44.12
* Scientific Misconception: 57.14
* Average: 45.31
* **Qwen2.5-0.5B:**
* Absurd Imagination: 26.92
* Commonsense Misunderstanding: 26.85
* Erroneous Assumption: 27.81
* Logical Error: 32.32
* Others: 17.65
* Scientific Misconception: 29.46
* Average: 27.70
* **Average:**
* Absurd Imagination: 71.54
* Commonsense Misunderstanding: 71.08
* Erroneous Assumption: 70.96
* Logical Error: 71.70
* Others: 65.62
* Scientific Misconception: 73.60
* Average: nan
### Key Observations
* The "Average" row shows the average performance across all models for each error category.
* The "Average" column shows the average performance of each model across all error categories.
* The value in the bottom right cell is "nan", indicating that the average of the averages is not calculated or is not a meaningful metric.
* The models generally perform better in "Absurd Imagination", "Commonsense Misunderstanding", "Erroneous Assumption", "Logical Error", and "Scientific Misconception" categories compared to the "Others" category.
* There is a significant performance difference between the top-performing models (e.g., claude-3-haiku-20240307, Qwen2.5-32B) and the bottom-performing models (e.g., Llama-3.2-1B, Qwen2.5-0.5B).
### Interpretation
The heatmap provides a comparative analysis of different language models based on their ability to avoid specific types of errors. The error categories likely represent different aspects of reasoning, knowledge, or common sense. The data suggests that some models are more robust to certain types of errors than others. For example, the higher scores in "Scientific Misconception" might indicate a better grasp of scientific concepts. The lower scores in "Others" suggest that this category might encompass more diverse or less well-defined errors. The "Average" row provides a benchmark for each error category, while the "Average" column gives an overall performance score for each model. The "nan" value in the bottom right suggests that a simple average of averages is not a useful metric in this context, possibly because the error categories are not equally weighted or because the models have different strengths and weaknesses.
DECODING INTELLIGENCE...