TECHNICAL ASSET FINGERPRINT
3a89013f775a57388eab856d
Click to view fullscreen
Press ESC or click to close
FOUND IN PAPERS
EXPERT: gemini-2.5-flash-lite-free VERSION 1
RUNTIME: google-free/gemini-2.5-flash-lite
INTEL_VERIFIED
## Data Table: Model Performance Metrics by Category
### Overview
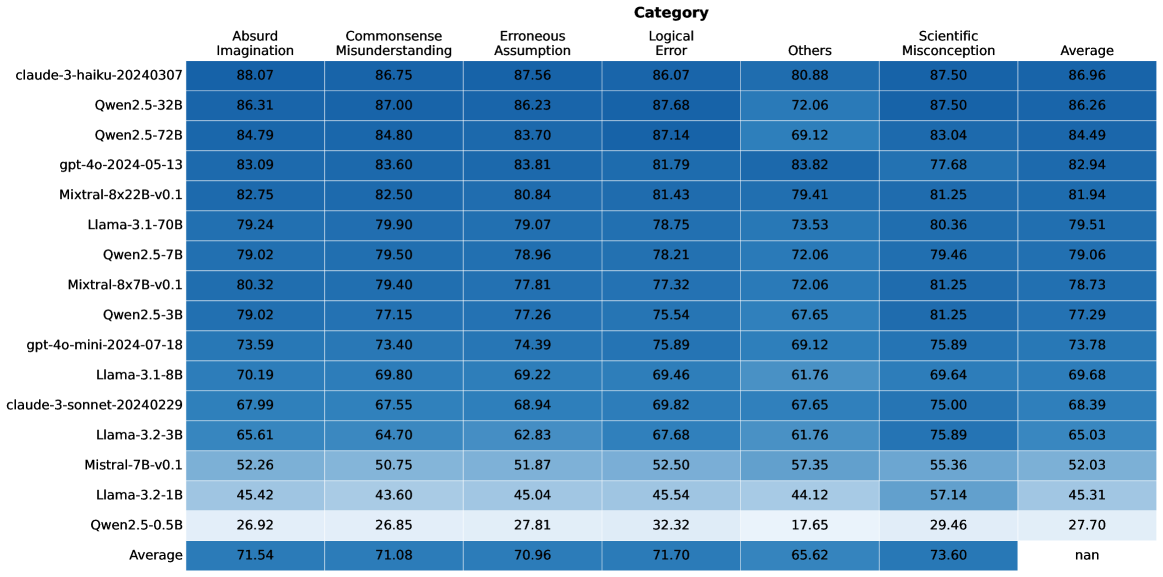
The image displays a data table that presents performance metrics for various language models across different categories of errors or assessments. The table lists model names on the left-hand side and categories of performance metrics as column headers. Numerical values, likely representing scores or percentages, are presented within the cells. The table also includes an "Average" row at the bottom, summarizing the performance across all listed models for each category.
### Components/Axes
**Row Headers (Model Names):**
* claude-3-haiku-20240307
* Qwen2.5-32B
* Qwen2.5-72B
* gpt-4o-2024-05-13
* Mixtral-8x22B-v0.1
* Llama-3.1-70B
* Qwen2.5-7B
* Mixtral-8x7B-v0.1
* Qwen2.5-3B
* gpt-4o-mini-2024-07-18
* Llama-3.1-8B
* claude-3-sonnet-20240229
* Llama-3.2-3B
* Mistral-7B-v0.1
* Llama-3.2-1B
* Qwen2.5-0.5B
* Average
**Column Headers (Categories):**
* Absurd Imagination
* Commonsense Misunderstanding
* Erroneous Assumption
* Category
* Logical Error
* Others
* Scientific Misconception
* Average
**Data Cells:** Numerical values ranging from approximately 26.92 to 88.07. The "Average" column for the "Average" row contains "nan" (Not a Number).
### Detailed Analysis
The table contains performance scores for 16 different language models, plus an overall average. The categories evaluated are: "Absurd Imagination", "Commonsense Misunderstanding", "Erroneous Assumption", "Logical Error", "Others", "Scientific Misconception", and a final "Average" score for each model.
**Model Performance Breakdown (Approximate Values):**
| Model Name | Absurd Imagination | Commonsense Misunderstanding | Erroneous Assumption | Logical Error | Others | Scientific Misconception | Average |
| :-------------------------- | :----------------- | :--------------------------- | :------------------- | :------------ | :----- | :----------------------- | :------ |
| claude-3-haiku-20240307 | 88.07 | 86.75 | 87.56 | 86.07 | 80.88 | 87.50 | 86.96 |
| Qwen2.5-32B | 86.31 | 87.00 | 86.23 | 87.68 | 72.06 | 87.50 | 86.26 |
| Qwen2.5-72B | 84.79 | 84.80 | 83.70 | 87.14 | 69.12 | 83.04 | 84.49 |
| gpt-4o-2024-05-13 | 83.09 | 83.60 | 83.81 | 81.79 | 83.82 | 77.68 | 82.94 |
| Mixtral-8x22B-v0.1 | 82.75 | 82.50 | 80.84 | 81.43 | 79.41 | 81.25 | 81.94 |
| Llama-3.1-70B | 79.24 | 79.90 | 79.07 | 78.75 | 73.53 | 80.36 | 79.51 |
| Qwen2.5-7B | 79.02 | 79.50 | 78.96 | 78.21 | 72.06 | 79.46 | 79.06 |
| Mixtral-8x7B-v0.1 | 80.32 | 79.40 | 77.81 | 77.32 | 72.06 | 81.25 | 78.73 |
| Qwen2.5-3B | 79.02 | 77.15 | 77.26 | 75.54 | 67.65 | 81.25 | 77.29 |
| gpt-4o-mini-2024-07-18 | 73.59 | 73.40 | 74.39 | 75.89 | 69.12 | 75.89 | 73.78 |
| Llama-3.1-8B | 70.19 | 69.80 | 69.22 | 69.46 | 61.76 | 69.64 | 69.68 |
| claude-3-sonnet-20240229 | 67.99 | 67.55 | 68.94 | 69.82 | 67.65 | 75.00 | 68.39 |
| Llama-3.2-3B | 65.61 | 64.70 | 62.83 | 67.68 | 61.76 | 75.89 | 65.03 |
| Mistral-7B-v0.1 | 52.26 | 50.75 | 51.87 | 52.50 | 57.35 | 55.36 | 52.03 |
| Llama-3.2-1B | 45.42 | 43.60 | 45.04 | 45.54 | 44.12 | 57.14 | 45.31 |
| Qwen2.5-0.5B | 26.92 | 26.85 | 27.81 | 32.32 | 17.65 | 29.46 | 27.70 |
**Average Row:**
| Category | Absurd Imagination | Commonsense Misunderstanding | Erroneous Assumption | Logical Error | Others | Scientific Misconception | Average |
| :----------------------- | :----------------- | :--------------------------- | :------------------- | :------------ | :----- | :----------------------- | :------ |
| Average | 71.54 | 71.08 | 70.96 | 71.70 | 65.62 | 73.60 | nan |
### Key Observations
* **Top Performers:** The models "claude-3-haiku-20240307" and "Qwen2.5-32B" consistently score the highest across most categories, with "claude-3-haiku-20240307" having the highest overall average score of 86.96.
* **Lowest Performers:** "Qwen2.5-0.5B" and "Llama-3.2-1B" exhibit the lowest scores across all categories, indicating significantly weaker performance.
* **Category Performance:** The "Others" category generally shows lower scores across most models compared to other categories like "Absurd Imagination" or "Commonsense Misunderstanding". The "Scientific Misconception" category has a wide range of scores, with some models performing very well and others poorly.
* **Inconsistent Performance:** Some models show significant variation in scores across categories. For example, "claude-3-sonnet-20240229" and "Llama-3.2-3B" perform relatively better in "Scientific Misconception" compared to other categories.
* **Average Row Anomaly:** The "Average" column for the "Average" row is marked as "nan", which is expected if it represents a calculation that cannot be performed (e.g., averaging averages without proper weighting, or if the underlying data for that specific cell is missing). However, the other average values in the "Average" row are meaningful.
### Interpretation
This data table appears to be a benchmark or evaluation of different language models' capabilities in handling various types of problematic or nuanced inputs. The categories likely represent different challenges or failure modes for AI models.
* **Model Strengths and Weaknesses:** The table clearly delineates which models excel in specific areas. For instance, "claude-3-haiku-20240307" seems to be a robust model across the board, while others might have specialized strengths. The low scores in the "Others" category suggest that this might be a more challenging or less well-defined area for current models.
* **Evolution of Models:** The presence of different versions (e.g., Qwen2.5-32B vs. Qwen2.5-7B, Llama-3.1 vs. Llama-3.2) and different model sizes (e.g., Llama-3.2-3B vs. Llama-3.2-1B) allows for an assessment of performance improvements with model size or architectural changes.
* **"Scientific Misconception" as a Key Metric:** The relatively high scores in "Scientific Misconception" for some top models, and the wide variance, suggest this is a critical area for evaluating factual accuracy and understanding of scientific concepts.
* **"nan" in Average:** The "nan" in the final "Average" cell for the "Average" column is likely a placeholder or an indication that the average of the "Average" column itself is not a meaningful metric in this context, or that the calculation was not performed. The other average values in the "Average" row are the mean scores for each category across all models.
Overall, the table provides a quantitative assessment of language model performance, allowing for direct comparison and identification of leaders and laggards in specific areas of AI reasoning and knowledge. The data suggests that while models are improving, there are still distinct areas where performance varies significantly.
DECODING INTELLIGENCE...