\n
## Bar Charts: Model Performance Metrics
### Overview
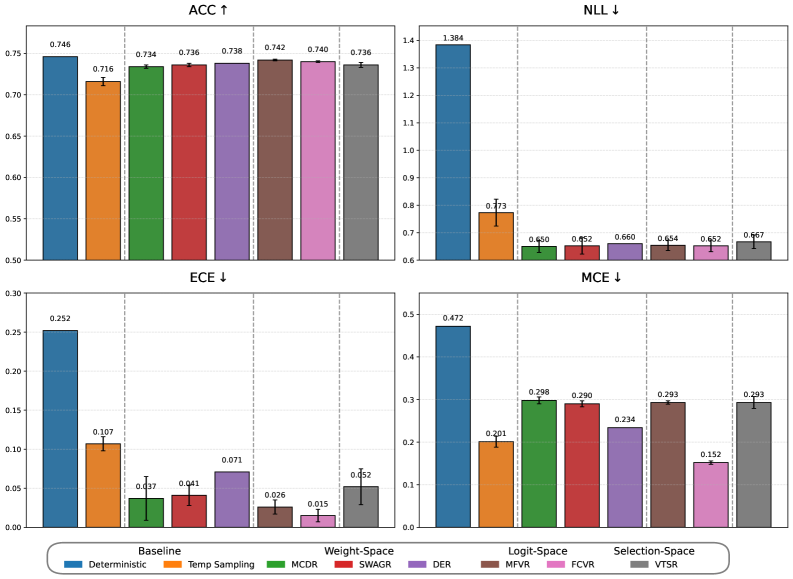
The image presents four bar charts comparing the performance of several models across four different metrics: Accuracy (ACC), Negative Log Likelihood (NLL), Expected Calibration Error (ECE), and Maximum Calibration Error (MCE). Each chart displays the metric value for different models, represented by colored bars with error bars. The models are categorized into Baseline, Weight-Space, Logit-Space, and Selection-Space.
### Components/Axes
* **X-axis:** Represents the different models. The models are: Deterministic, Temp Sampling, MCDR, SWAGR, DER, MFVR, FCVR, VTSR.
* **Y-axis:** Represents the metric value. The scales vary for each chart.
* ACC: 0.50 to 0.75
* NLL: 0.60 to 1.40
* ECE: 0.00 to 0.30
* MCE: 0.00 to 0.50
* **Legend:** Located at the bottom of the image, it maps colors to model names.
* Baseline: Blue
* Weight-Space: Green
* Logit-Space: Red
* Selection-Space: Purple
* **Titles:** Each chart has a title indicating the metric being displayed, along with an arrow indicating whether a lower or higher value is better (↑ for higher, ↓ for lower).
### Detailed Analysis or Content Details
**1. ACC ↑ (Accuracy)**
* **Deterministic (Blue):** 0.746 ± ~0.005
* **Temp Sampling (Blue):** 0.716 ± ~0.005
* **MCDR (Green):** 0.734 ± ~0.005
* **SWAGR (Green):** 0.738 ± ~0.005
* **DER (Red):** 0.742 ± ~0.005
* **MFVR (Red):** 0.740 ± ~0.005
* **FCVR (Purple):** 0.736 ± ~0.005
The accuracy values are relatively high across all models, ranging from approximately 0.716 to 0.746. The deterministic model has the highest accuracy.
**2. NLL ↓ (Negative Log Likelihood)**
* **Deterministic (Blue):** 1.384 ± ~0.01
* **Temp Sampling (Blue):** 0.73 ± ~0.01
* **MCDR (Green):** 0.690 ± ~0.01
* **SWAGR (Green):** 0.660 ± ~0.01
* **DER (Red):** 0.654 ± ~0.01
* **MFVR (Red):** 0.652 ± ~0.01
* **FCVR (Purple):** 0.667 ± ~0.01
The NLL values vary significantly. The deterministic model has the highest NLL, while the other models have lower values, ranging from approximately 0.652 to 0.73.
**3. ECE ↓ (Expected Calibration Error)**
* **Deterministic (Blue):** 0.252 ± ~0.01
* **Temp Sampling (Blue):** 0.107 ± ~0.01
* **MCDR (Green):** 0.041 ± ~0.005
* **SWAGR (Green):** 0.071 ± ~0.005
* **DER (Red):** 0.015 ± ~0.005
* **MFVR (Red):** 0.052 ± ~0.005
* **FCVR (Purple):** 0.026 ± ~0.005
The ECE values are generally low, with the deterministic model having the highest value. The other models have ECE values ranging from approximately 0.015 to 0.107.
**4. MCE ↓ (Maximum Calibration Error)**
* **Deterministic (Blue):** 0.472 ± ~0.02
* **Temp Sampling (Blue):** 0.201 ± ~0.02
* **MCDR (Green):** 0.298 ± ~0.02
* **SWAGR (Green):** 0.290 ± ~0.02
* **DER (Red):** 0.234 ± ~0.02
* **MFVR (Red):** 0.152 ± ~0.02
* **FCVR (Purple):** 0.293 ± ~0.02
The MCE values show a similar trend to ECE, with the deterministic model having the highest value. The other models have MCE values ranging from approximately 0.152 to 0.298.
### Key Observations
* The Deterministic model consistently performs well on ACC but poorly on NLL, ECE, and MCE.
* Models in the Weight-Space and Logit-Space categories generally outperform the Baseline models (Deterministic and Temp Sampling) on NLL, ECE, and MCE.
* The Selection-Space model (FCVR) shows competitive performance on all metrics.
* Error bars are relatively small, suggesting consistent results.
### Interpretation
The data suggests that while the Deterministic model achieves high accuracy, it suffers from poor calibration (high ECE and MCE) and a high negative log-likelihood. This indicates that its confidence scores are not well-aligned with its actual accuracy. The other models, particularly those in the Weight-Space and Logit-Space categories, demonstrate better calibration and lower NLL, suggesting they provide more reliable and well-calibrated predictions. The Selection-Space model (FCVR) offers a good balance between accuracy and calibration.
The differences in performance across the metrics highlight the trade-offs between accuracy and calibration. A model can achieve high accuracy by being overconfident in its predictions, but this can lead to poor calibration. The models that prioritize calibration (lower NLL, ECE, and MCE) may sacrifice some accuracy, but they provide more trustworthy predictions. The choice of which model to use depends on the specific application and the relative importance of accuracy and calibration.