\n
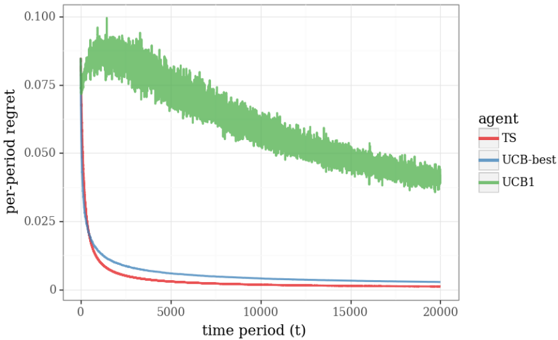
## Line Chart: Per-Period Regret vs. Time Period for Different Agents
### Overview
This image presents a line chart illustrating the per-period regret of three different agents (TS, UCB-best, and UCB1) over a time period of 20,000 units. The chart aims to compare the performance of these agents in terms of their cumulative regret as time progresses.
### Components/Axes
* **X-axis:** "time period (t)", ranging from approximately 0 to 20,000.
* **Y-axis:** "per-period regret", ranging from approximately 0 to 0.105.
* **Legend:** Located in the top-right corner, identifying the three agents:
* TS (represented by a red line)
* UCB-best (represented by a blue line)
* UCB1 (represented by a green line)
* **Gridlines:** Present to aid in reading values.
### Detailed Analysis
The chart displays three distinct lines representing the per-period regret of each agent over time.
* **TS (Red Line):** The line starts at approximately 0.095 at t=0, rapidly decreases to approximately 0.015 by t=1000, and then continues to decrease, leveling off around 0.005-0.01 for t > 10,000. The trend is strongly downward, indicating a rapid reduction in regret.
* **UCB-best (Blue Line):** The line begins at approximately 0.04 at t=0, decreases more gradually than TS, reaching approximately 0.005 by t=1000, and then levels off around 0.002-0.004 for t > 5000. The trend is downward, but less steep than TS.
* **UCB1 (Green Line):** The line starts at approximately 0.085 at t=0, initially increases to a peak of approximately 0.09 at t=500, then decreases steadily, but remains significantly higher than the other two lines. By t=20,000, the regret is approximately 0.045. The trend is initially upward, followed by a gradual downward slope.
### Key Observations
* **TS** exhibits the fastest initial reduction in regret.
* **UCB-best** has the lowest overall regret, especially in the long run (t > 5000).
* **UCB1** starts with a relatively high regret, experiences an initial increase, and then decreases, but remains the highest among the three agents throughout the entire time period.
* All three agents demonstrate a decreasing trend in per-period regret as time progresses, suggesting that they all learn and improve their decision-making over time.
### Interpretation
The data suggests that the TS agent learns quickly initially, but its regret plateaus at a higher level than UCB-best. UCB-best demonstrates a more stable and consistently low regret, indicating a more robust and efficient learning strategy. UCB1, while eventually decreasing, exhibits a slower learning rate and a higher overall regret compared to the other two agents.
The initial increase in regret for UCB1 could be attributed to an exploration phase where the agent is actively trying different options to gather information. The subsequent decrease indicates that the agent is learning from its experiences and improving its decision-making. The difference in performance between the agents likely stems from their underlying algorithms and how they balance exploration and exploitation.
The chart highlights the trade-off between initial learning speed and long-term performance. TS learns quickly but doesn't achieve the lowest possible regret, while UCB-best learns more slowly but ultimately outperforms the other agents in terms of minimizing regret. This information is valuable for selecting the appropriate agent for a given application, depending on the specific requirements and priorities.