## Principal Component Analysis (PCA) of Expert Data
### Overview
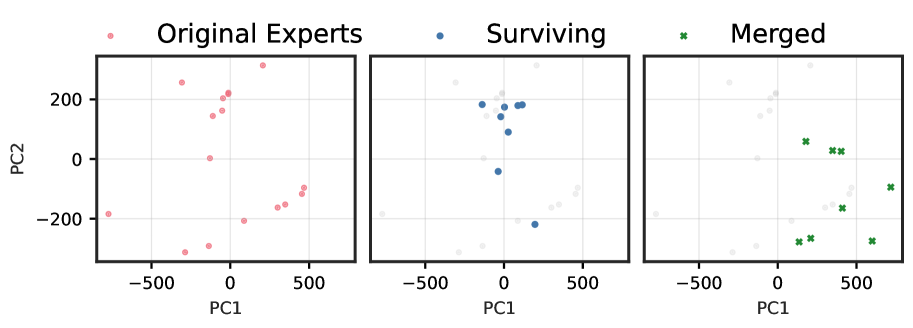
The image displays three separate PCA plots, each representing a different group of experts: Original Experts, Surviving Experts, and Merged Experts. The plots are visualizations of the principal components (PC1 and PC2) of the data, which are likely derived from a dataset of expert opinions or performance metrics.
### Components/Axes
- **X-axis (PC1)**: Represents the first principal component, which captures the most variance in the data.
- **Y-axis (PC2)**: Represents the second principal component, which captures the second most variance in the data.
- **Legend**: The legend on the right side of each plot indicates the color coding for the three groups of experts.
- **Data Points**: Each point on the plot corresponds to an individual expert, with its position determined by its values on PC1 and PC2.
### Detailed Analysis or ### Content Details
- **Original Experts**: The data points for Original Experts are scattered across the entire range of PC1 and PC2, indicating a wide variety of opinions or performance metrics.
- **Surviving Experts**: The data points for Surviving Experts are more clustered towards the center of the plot, suggesting a more cohesive group with similar opinions or performance metrics.
- **Merged Experts**: The data points for Merged Experts are also clustered but are more spread out compared to the Surviving Experts, indicating a mix of opinions or performance metrics.
### Key Observations
- **Original Experts**: The wide spread of data points suggests a diverse group with varying opinions or performance metrics.
- **Surviving Experts**: The clustering of data points towards the center suggests a more cohesive group with similar opinions or performance metrics.
- **Merged Experts**: The spread out data points suggest a mix of opinions or performance metrics, indicating a combination of different expertise or perspectives.
### Interpretation
The PCA plots provide insights into the distribution and clustering of expert opinions or performance metrics. The Original Experts show a wide variety of opinions, while the Surviving Experts and Merged Experts show more cohesion. This could indicate that the Merged Experts have a mix of different expertise or perspectives, which may be beneficial for a more comprehensive analysis. The Surviving Experts, on the other hand, may have a more unified approach or set of criteria for evaluation. The plots suggest that the data is well-structured and that the principal components are effective in capturing the underlying patterns in the data.