## Line Chart: PNN Performance vs. Epochs
### Overview
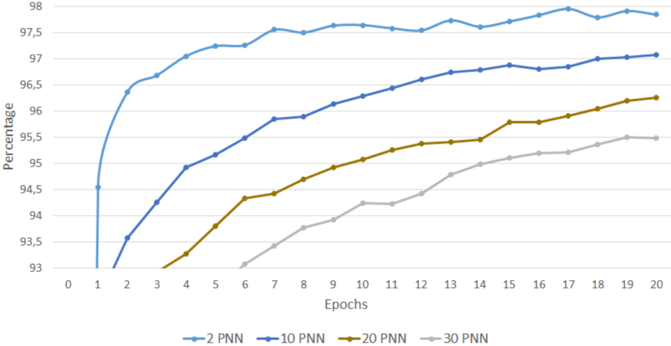
The image is a line chart comparing the performance of different Probabilistic Neural Networks (PNNs) based on the number of epochs. The chart displays the percentage (performance metric) on the y-axis against the number of epochs on the x-axis. Four different PNN configurations (2 PNN, 10 PNN, 20 PNN, and 30 PNN) are plotted, each represented by a distinct colored line.
### Components/Axes
* **X-axis:** Epochs, ranging from 0 to 20 in increments of 1.
* **Y-axis:** Percentage, ranging from 93 to 98 in increments of 0.5.
* **Legend:** Located at the bottom of the chart, associating each line color with a PNN configuration:
* Blue: 2 PNN
* Dark Blue: 10 PNN
* Olive/Brown: 20 PNN
* Light Gray: 30 PNN
### Detailed Analysis
* **2 PNN (Blue):** This line shows a rapid increase in percentage from epoch 1 to epoch 2, reaching approximately 96.5%. After epoch 2, the line plateaus and fluctuates slightly between 97.5% and 98% until epoch 20.
* Epoch 0: ~93%
* Epoch 1: ~96%
* Epoch 2: ~97%
* Epoch 20: ~97.8%
* **10 PNN (Dark Blue):** The line starts at approximately 93% at epoch 2 and gradually increases to approximately 97% by epoch 20. The slope decreases as the number of epochs increases.
* Epoch 2: ~93%
* Epoch 5: ~95%
* Epoch 10: ~96%
* Epoch 20: ~97%
* **20 PNN (Olive/Brown):** This line starts at approximately 93% at epoch 3 and increases to approximately 96% by epoch 20. The rate of increase slows down as the number of epochs increases.
* Epoch 3: ~93%
* Epoch 10: ~94.8%
* Epoch 20: ~96.2%
* **30 PNN (Light Gray):** This line starts at approximately 93% at epoch 4 and increases to approximately 95% by epoch 20. The rate of increase slows down as the number of epochs increases.
* Epoch 4: ~93%
* Epoch 10: ~94.2%
* Epoch 20: ~95.2%
### Key Observations
* The 2 PNN configuration achieves the highest percentage and plateaus quickly.
* The 10 PNN, 20 PNN, and 30 PNN configurations show a gradual increase in percentage with increasing epochs, with the 10 PNN configuration performing better than the 20 PNN and 30 PNN configurations.
* All configurations show diminishing returns with increasing epochs, as the rate of increase in percentage decreases.
### Interpretation
The chart suggests that the 2 PNN configuration is the most efficient, achieving high performance with fewer epochs. The other configurations (10 PNN, 20 PNN, and 30 PNN) require more epochs to reach comparable performance levels. The diminishing returns observed across all configurations indicate that there is a point beyond which increasing the number of epochs does not significantly improve performance. The data implies that the complexity of the PNN (number of PNN) has an inverse relationship with the speed of learning, but a direct relationship with the final performance. The 2 PNN model learns very quickly, but the other models eventually catch up.