\n
## Chart: Verification Performance of SAT/UNSAT Property Checkers
### Overview
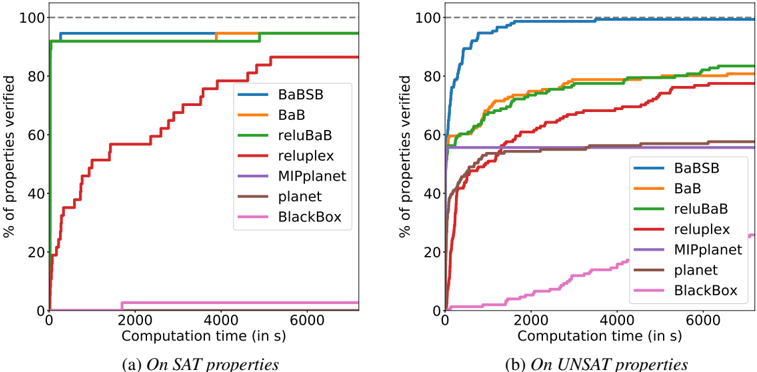
The image presents two line charts, labeled (a) and (b), comparing the performance of several property verification tools on SAT and UNSAT properties, respectively. The x-axis represents computation time in seconds, and the y-axis represents the percentage of properties verified. Each line represents a different verification tool.
### Components/Axes
* **X-axis (Both Charts):** Computation time (in s), ranging from 0 to 6000 seconds.
* **Y-axis (Both Charts):** % of properties verified, ranging from 0 to 100%.
* **Legend (Both Charts):**
* BaBSB (Blue)
* BaB (Orange)
* reluBaB (Green)
* reluplex (Red)
* MIPplanet (Purple)
* planet (Brown)
* BlackBox (Pink)
* **Chart (a):** Title: "On SAT properties"
* **Chart (b):** Title: "On UNSAT properties"
* **Horizontal dashed line (Both Charts):** At 100% verification.
### Detailed Analysis or Content Details
**Chart (a): On SAT properties**
* **BaBSB (Blue):** Starts at approximately 0% at 0s, quickly rises to approximately 95% verified by 1000s, and plateaus around 98-100% for the remainder of the time.
* **BaB (Orange):** Starts at 0% at 0s, rises steadily to approximately 80% verified by 6000s.
* **reluBaB (Green):** Starts at 0% at 0s, rises rapidly to approximately 95% verified by 1000s, and remains near 100% for the rest of the time.
* **reluplex (Red):** Starts at 0% at 0s, rises slowly, reaching approximately 60% verified by 6000s.
* **MIPplanet (Purple):** Starts at 0% at 0s, rises moderately to approximately 70% verified by 6000s.
* **planet (Brown):** Starts at 0% at 0s, rises slowly, reaching approximately 40% verified by 6000s.
* **BlackBox (Pink):** Starts at 0% at 0s, rises rapidly to approximately 80% verified by 2000s, and plateaus around 85-90% for the remainder of the time.
**Chart (b): On UNSAT properties**
* **BaBSB (Blue):** Starts at 0% at 0s, rises very quickly to approximately 95% verified by 1000s, and remains near 100% for the rest of the time.
* **BaB (Orange):** Starts at 0% at 0s, rises steadily to approximately 75% verified by 6000s.
* **reluBaB (Green):** Starts at 0% at 0s, rises rapidly to approximately 85% verified by 1000s, and plateaus around 85-90% for the rest of the time.
* **reluplex (Red):** Starts at 0% at 0s, rises slowly, reaching approximately 50% verified by 6000s.
* **MIPplanet (Purple):** Starts at 0% at 0s, rises moderately to approximately 60% verified by 6000s.
* **planet (Brown):** Starts at 0% at 0s, rises slowly, reaching approximately 30% verified by 6000s.
* **BlackBox (Pink):** Starts at 0% at 0s, rises rapidly to approximately 60% verified by 2000s, and plateaus around 65-70% for the remainder of the time.
### Key Observations
* For both SAT and UNSAT properties, BaBSB and reluBaB consistently outperform other tools, achieving high verification rates within a short computation time.
* reluplex and planet consistently show the lowest verification rates for both SAT and UNSAT properties.
* The performance difference between tools is more pronounced on SAT properties than on UNSAT properties.
* BlackBox shows a rapid initial increase in verification rate, but plateaus at a lower level compared to BaBSB and reluBaB.
### Interpretation
The charts demonstrate the effectiveness of different property verification tools on SAT and UNSAT problems. BaBSB and reluBaB appear to be the most efficient and reliable tools, capable of verifying a large percentage of properties within a relatively short time frame. The significant difference in performance suggests that the underlying algorithms and implementation details of these tools are superior.
The fact that the performance gap between tools is wider for SAT properties might indicate that the tools are more sensitive to the specific characteristics of SAT problems. The lower verification rates for reluplex and planet could be due to limitations in their ability to handle complex SAT or UNSAT instances.
The plateauing of some lines (e.g., BlackBox) suggests that the tools reach a point where further computation time does not yield significant improvements in verification rate, possibly due to the inherent difficulty of the remaining properties or limitations in the search strategy. The horizontal dashed line at 100% serves as a benchmark, highlighting the tools that come closest to achieving complete verification.