## Line Graph: Benchmark: Average
### Overview
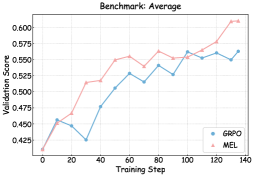
The image is a line graph comparing the validation scores of two models, GRPO (blue) and MEL (pink), across training steps. The x-axis represents training steps (0–140), and the y-axis represents validation scores (0.425–0.600). Both lines show upward trends, with MEL consistently outperforming GRPO after ~60 training steps.
### Components/Axes
- **Title**: "Benchmark: Average" (top center).
- **X-axis**: "Training Step" (0–140, increments of 20).
- **Y-axis**: "Validation Score" (0.425–0.600, increments of 0.025).
- **Legend**: Bottom-right corner, with:
- Blue circle: "GRPO"
- Pink triangle: "MEL"
- **Grid**: Light gray grid lines for reference.
### Detailed Analysis
1. **GRPO (Blue Line)**:
- Starts at ~0.45 (step 0).
- Dips to ~0.425 at step 30.
- Rises to ~0.575 at step 100.
- Ends at ~0.57 (step 140).
- Fluctuations: Minor dips at steps 30 and 90.
2. **MEL (Pink Line)**:
- Starts at ~0.425 (step 0).
- Rises steadily to ~0.55 at step 60.
- Peaks at ~0.600 by step 140.
- Fluctuations: Slight dip at step 80 (~0.54).
### Key Observations
- **MEL outperforms GRPO** after ~60 training steps, with a steeper slope.
- **GRPO** experiences a temporary dip at step 30 but recovers by step 60.
- Both models plateau near ~0.57 by step 140, but MEL maintains a higher score throughout.
### Interpretation
The graph demonstrates that MEL achieves higher validation scores than GRPO as training progresses, suggesting superior performance in this benchmark. The GRPO model shows resilience after an early dip, but MEL’s consistent growth indicates better optimization. The final scores (~0.57 for both) imply that while MEL is more effective, GRPO remains competitive with potential for further improvement. The trends highlight the importance of training duration and model architecture in achieving optimal validation performance.