## Image Comparison: Ground Truth vs. Reconstructed Images at Varying Frequencies
### Overview
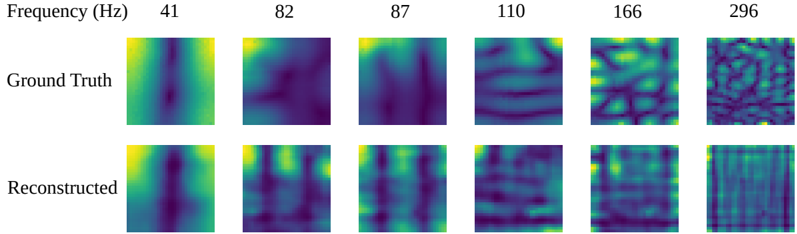
The image presents a visual comparison between "Ground Truth" and "Reconstructed" images at different frequencies. Each image is a square, and the color within each square represents some value, likely intensity or amplitude. The frequencies range from 41 Hz to 296 Hz. The image is arranged in a 2x6 grid, with the top row showing the ground truth and the bottom row showing the reconstructed images.
### Components/Axes
* **X-axis (Frequency):** The frequencies are displayed above each column of images. The values are 41 Hz, 82 Hz, 87 Hz, 110 Hz, 166 Hz, and 296 Hz.
* **Y-axis (Image Type):** The rows are labeled "Ground Truth" (top row) and "Reconstructed" (bottom row).
* **Image Color:** The color within each image likely represents a magnitude or intensity. The color scale appears to range from dark blue/purple (low) to yellow (high).
### Detailed Analysis or ### Content Details
**Ground Truth Images:**
* **41 Hz:** A vertical band of higher intensity (yellow/green) is visible in the center of the image, surrounded by lower intensity (blue/purple) regions.
* **82 Hz:** The image shows a more diffuse pattern, with a central region of higher intensity and less distinct boundaries compared to 41 Hz.
* **87 Hz:** Similar to 82 Hz, but with a slightly more defined vertical structure.
* **110 Hz:** The image displays a more complex pattern with horizontal bands of varying intensity.
* **166 Hz:** The pattern becomes even more complex, with a grid-like structure of alternating high and low intensity regions.
* **296 Hz:** The image appears highly textured and noisy, with a fine-grained pattern of high and low intensity regions.
**Reconstructed Images:**
* **41 Hz:** The reconstructed image captures the central vertical band of higher intensity, but it appears less sharp and more blurred than the ground truth.
* **82 Hz:** The reconstructed image shows a similar diffuse pattern to the ground truth, but with less contrast.
* **87 Hz:** The reconstructed image captures the vertical structure, but it is less defined than in the ground truth.
* **110 Hz:** The reconstructed image shows horizontal bands, but they are less distinct and more blurred compared to the ground truth.
* **166 Hz:** The reconstructed image captures the grid-like structure, but the contrast between high and low intensity regions is reduced.
* **296 Hz:** The reconstructed image shows a textured pattern, but it appears smoother and less noisy than the ground truth.
### Key Observations
* As frequency increases, the complexity of the image patterns increases in both the ground truth and reconstructed images.
* The reconstructed images generally capture the main features of the ground truth images, but with reduced contrast and sharpness.
* The reconstruction quality appears to decrease slightly as frequency increases, with the reconstructed image at 296 Hz being the least similar to its ground truth counterpart.
### Interpretation
The image demonstrates the performance of a reconstruction algorithm at different frequencies. The comparison between the ground truth and reconstructed images provides a visual assessment of the algorithm's ability to capture the underlying patterns at each frequency. The reduced contrast and sharpness in the reconstructed images suggest that the algorithm may be losing some information during the reconstruction process. The decreasing reconstruction quality at higher frequencies indicates that the algorithm may have limitations in capturing the fine details of complex patterns. This could be due to factors such as the algorithm's resolution, noise sensitivity, or ability to handle high-frequency components.