# Technical Data Extraction: MATH Test Performance Analysis
This document provides a comprehensive extraction of data and trends from two technical charts analyzing the performance of a model on the MATH test suite, focusing on the relationship between sequential/parallel processing ratios and accuracy.
---
## Chart 1: Varying Sequential/Parallel with Majority
### Metadata and Layout
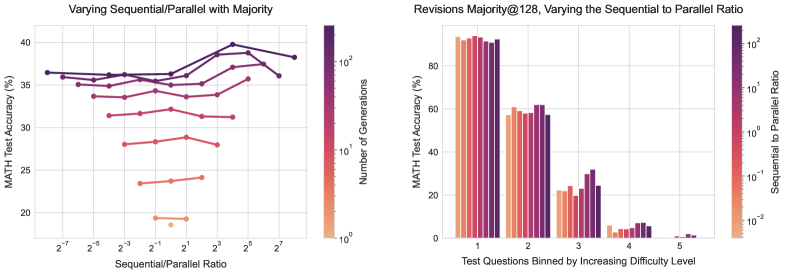
* **Title:** Varying Sequential/Parallel with Majority
* **Y-Axis Label:** MATH Test Accuracy (%)
* **Y-Axis Scale:** Linear, ranging from 20 to 40 (with markers at 20, 25, 30, 35, 40).
* **X-Axis Label:** Sequential/Parallel Ratio
* **X-Axis Scale:** Logarithmic (base 2), ranging from $2^{-7}$ to $2^{7}$.
* **Legend (Color Bar):** Located at the far right.
* **Label:** Number of Generations
* **Scale:** Logarithmic, ranging from $10^0$ (1) to $10^2$ (100+).
* **Color Gradient:** Light orange (low generations) to dark purple (high generations).
### Data Series Analysis
The chart contains approximately 9 distinct line series, each representing a different "Number of Generations."
1. **High Generation Series (Dark Purple, ~128-256 generations):**
* **Trend:** Starts relatively flat at ~36% accuracy for low ratios ($2^{-7}$ to $2^{1}$), then exhibits a significant upward peak reaching nearly 40% at a ratio of $2^4$, before declining slightly at $2^7$.
* **Peak Value:** ~39.8% accuracy at $2^4$ ratio.
2. **Mid-High Generation Series (Deep Magenta/Purple):**
* **Trend:** Follows a similar pattern but with lower overall accuracy. Peaks around $2^5$ ratio at ~37% accuracy.
3. **Mid-Range Generation Series (Magenta/Pink):**
* **Trend:** These lines are shorter, centered around the $2^0$ to $2^3$ ratio range. They show a slight upward slope as the ratio increases. Accuracy ranges between 28% and 34%.
4. **Low Generation Series (Orange/Light Coral):**
* **Trend:** These are the shortest segments, appearing only near the center of the X-axis ($2^{-1}$ to $2^2$).
* **Lowest Data Point:** A single orange dot at $2^0$ ratio representing ~18.5% accuracy (1 generation).
### Key Findings
* **Scaling:** Increasing the "Number of Generations" significantly improves accuracy across all ratios.
* **Optimal Ratio:** For high generation counts, a Sequential/Parallel ratio between $2^3$ and $2^5$ (8 to 32) yields the highest accuracy.
---
## Chart 2: Revisions Majority@128, Varying the Sequential to Parallel Ratio
### Metadata and Layout
* **Title:** Revisions Majority@128, Varying the Sequential to Parallel Ratio
* **Y-Axis Label:** MATH Test Accuracy (%)
* **Y-Axis Scale:** Linear, 0 to 80+ (markers at 0, 20, 40, 60, 80).
* **X-Axis Label:** Test Questions Binned by Increasing Difficulty Level
* **X-Axis Categories:** 1, 2, 3, 4, 5 (representing difficulty levels).
* **Legend (Color Bar):** Located at the far right.
* **Label:** Sequential to Parallel Ratio
* **Scale:** Logarithmic, ranging from $10^{-2}$ to $10^2$.
* **Color Gradient:** Light orange (low ratio) to dark purple (high ratio).
### Data Table Reconstruction (Approximate Values)
Each difficulty bin contains a cluster of bars representing different Sequential to Parallel ratios.
| Difficulty Level | Trend Across Ratios | Approx. Accuracy Range |
| :--- | :--- | :--- |
| **1 (Easiest)** | Relatively stable; slight increase with higher ratios. | 90% - 95% |
| **2** | Stable; slight peak in the mid-to-high ratio range (purple bars). | 58% - 62% |
| **3** | Significant upward trend; higher ratios (purple) perform much better than lower ratios (orange). | 20% - 32% |
| **4** | Upward trend; higher ratios show visible improvement over lower ratios. | 2% - 8% |
| **5 (Hardest)** | Very low accuracy; only the highest ratios (purple) show any measurable success. | 0% - 2% |
### Component Isolation & Trend Verification
* **Difficulty 1:** The model performs exceptionally well regardless of the ratio, though dark purple bars (high ratio) are slightly taller.
* **Difficulty 3:** This bin shows the most dramatic impact of the ratio. The light orange bars ($10^{-2}$) are at ~22%, while the dark purple bars ($10^2$) reach ~32%.
* **Overall Trend:** As difficulty increases, the total accuracy drops precipitously. However, the benefit of a higher Sequential to Parallel ratio (darker bars) becomes more pronounced in the mid-to-high difficulty tasks (Levels 3, 4, and 5).
---
## Summary of Visual Information
The combined data suggests that while increasing the total number of generations (Chart 1) provides a baseline performance boost, the **ratio** of sequential to parallel processing is a critical hyperparameter. Specifically, a higher sequential ratio (more steps of reasoning vs. more parallel attempts) is particularly beneficial for solving more difficult mathematical problems.