## Bar Chart: Average Episode Length by Reinforcement Learning Algorithm
### Overview
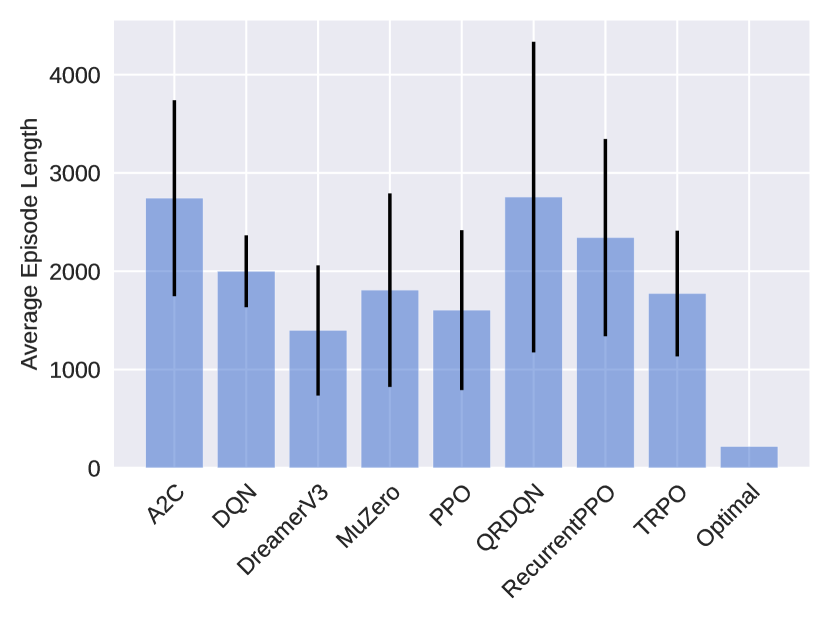
The image displays a vertical bar chart comparing the average episode length across nine different reinforcement learning algorithms and one optimal baseline. Each bar represents the mean episode length for an algorithm, with a black vertical error bar indicating the variability or standard deviation around that mean. The chart uses a consistent blue color for all bars against a light gray grid background.
### Components/Axes
* **Y-Axis (Vertical):** Labeled "Average Episode Length". The scale runs from 0 to 4000, with major grid lines and labels at intervals of 1000 (0, 1000, 2000, 3000, 4000).
* **X-Axis (Horizontal):** Lists the names of the algorithms being compared. The labels are rotated approximately 45 degrees for readability. From left to right, they are:
1. A2C
2. DQN
3. DreamerV3
4. MuZero
5. PPO
6. QRDQN
7. RecurrentPPO
8. TRPO
9. Optimal
* **Data Series:** A single data series represented by blue bars. Each bar has a corresponding black error bar.
* **Legend:** No separate legend is present; the X-axis labels serve as the key for the bars.
### Detailed Analysis
The following table reconstructs the approximate data from the chart. Values are estimated based on the bar heights and error bar extents relative to the Y-axis scale. **Note:** All numerical values are approximate visual estimates.
| Algorithm (X-axis) | Approx. Average Episode Length (Bar Height) | Approx. Error Bar Range (Min to Max) | Visual Trend Description |
| :--- | :--- | :--- | :--- |
| **A2C** | ~2750 | ~1800 to ~3700 | Tall bar with a very large error bar, indicating high mean and high variance. |
| **DQN** | ~2000 | ~1600 to ~2400 | Moderate height bar with a moderate error bar. |
| **DreamerV3** | ~1400 | ~800 to ~2000 | One of the shorter bars with a moderate error bar. |
| **MuZero** | ~1800 | ~800 to ~2800 | Moderate height bar with a very large error bar, indicating high variance. |
| **PPO** | ~1600 | ~800 to ~2400 | Moderate height bar with a large error bar. |
| **QRDQN** | ~2750 | ~1200 to ~4300 | Tall bar (similar to A2C) with the largest error bar on the chart, indicating extremely high variance. |
| **RecurrentPPO** | ~2350 | ~1350 to ~3350 | Tall bar with a large error bar. |
| **TRPO** | ~1800 | ~1150 to ~2450 | Moderate height bar with a moderate error bar. |
| **Optimal** | ~200 | No visible error bar | Extremely short bar, indicating a very low average episode length with negligible variance. |
### Key Observations
1. **Performance Spread:** There is a wide spread in average episode lengths, from ~200 (Optimal) to ~2750 (A2C, QRDQN).
2. **High Variance:** Most algorithms (especially A2C, MuZero, PPO, QRDQN, RecurrentPPO) exhibit very large error bars, suggesting their performance is highly variable across different runs or conditions.
3. **Optimal Baseline:** The "Optimal" bar is dramatically shorter than all others, serving as a clear performance benchmark.
4. **Top Performers (by lower average length):** DreamerV3 (~1400) and PPO (~1600) have the lowest average episode lengths among the non-optimal algorithms.
5. **Highest Variance:** QRDQN shows the greatest uncertainty, with an error bar spanning over 3000 units.
### Interpretation
This chart likely compares the efficiency of different reinforcement learning algorithms on a specific task where a shorter episode length is better (e.g., solving a maze faster, completing a game level quicker). The "Optimal" value represents a theoretical or known best-possible performance.
The data suggests that while algorithms like DreamerV3 and PPO achieve relatively efficient (shorter) episodes on average, their performance is not consistently reliable, as indicated by the large error bars. In contrast, the "Optimal" solution is both highly efficient and perfectly consistent. The extremely high variance for algorithms like QRDQN and A2C implies they may be sensitive to initial conditions or hyperparameters, making their performance less predictable. For a practitioner, this chart highlights not just the average performance but the critical importance of stability and reproducibility, which many of these algorithms lack in this particular scenario. The significant overlap in the error bars of many algorithms (e.g., DQN, MuZero, TRPO) suggests that the differences in their average performance may not be statistically significant.