## Chart: Final Error vs Regularization and Optimal Learning Rate vs Training Time
### Overview
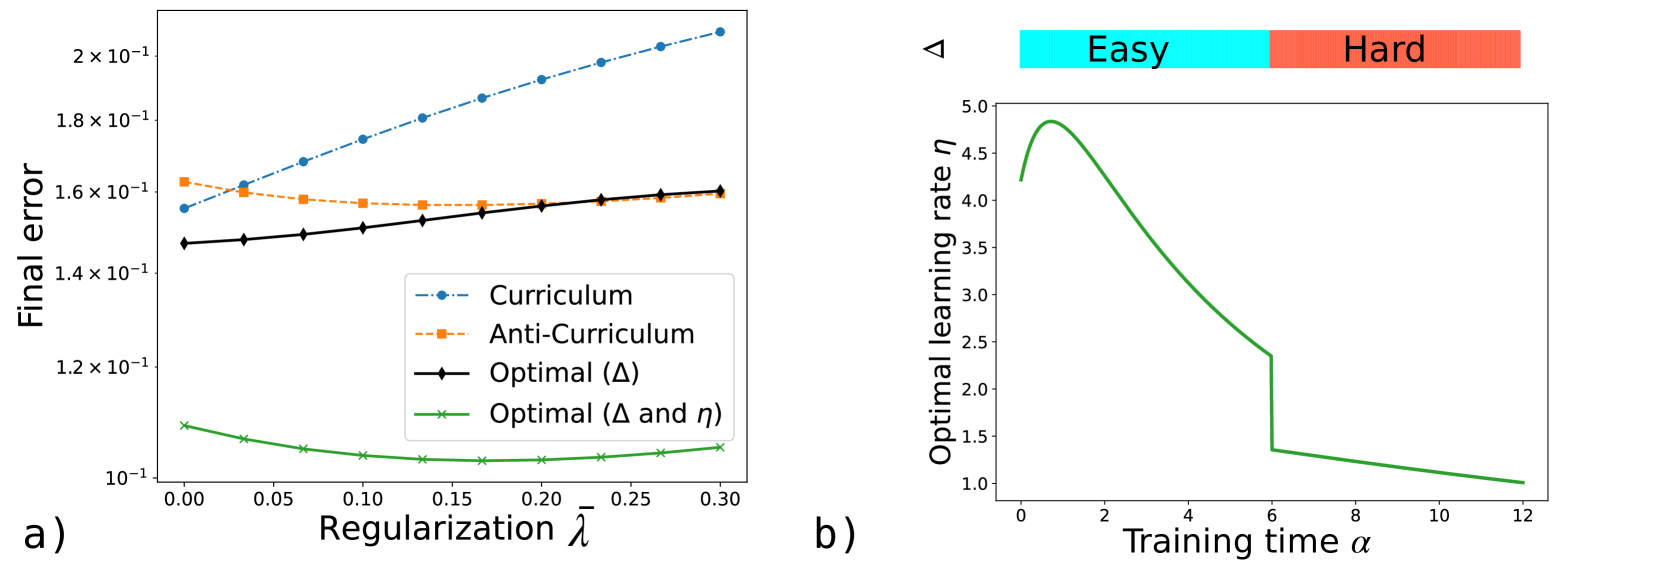
The image presents two plots. The left plot (a) shows the final error as a function of regularization for different training methods: Curriculum, Anti-Curriculum, Optimal (Δ), and Optimal (Δ and η). The right plot (b) illustrates the optimal learning rate as a function of training time, segmented into "Easy" and "Hard" regions.
### Components/Axes
**Plot a) Final Error vs Regularization:**
* **Y-axis:** "Final error" with a logarithmic scale (10<sup>-1</sup>). The axis ranges from approximately 1.0 x 10<sup>-1</sup> to 2.0 x 10<sup>-1</sup>.
* **X-axis:** "Regularization λ" ranging from 0.00 to 0.30 in increments of 0.05.
* **Legend (bottom-left):**
* Blue dashed line with circles: "Curriculum"
* Orange dashed line with squares: "Anti-Curriculum"
* Black solid line with diamonds: "Optimal (Δ)"
* Green solid line with crosses: "Optimal (Δ and η)"
**Plot b) Optimal Learning Rate vs Training Time:**
* **Y-axis:** "Optimal learning rate η" ranging from 1.0 to 5.0 in increments of 0.5.
* **X-axis:** "Training time α" ranging from 0 to 12 in increments of 2.
* **Top:** A horizontal bar divided into two sections:
* Left (cyan): "Easy"
* Right (coral): "Hard"
* **Data Series:** A single green line representing the optimal learning rate.
### Detailed Analysis
**Plot a) Final Error vs Regularization:**
* **Curriculum (Blue):** The final error increases as regularization increases. At λ = 0, the final error is approximately 0.15 x 10<sup>-1</sup>, and at λ = 0.3, it's approximately 0.21 x 10<sup>-1</sup>.
* **Anti-Curriculum (Orange):** The final error starts at approximately 0.16 x 10<sup>-1</sup>, decreases slightly to about 0.155 x 10<sup>-1</sup>, and then remains relatively constant as regularization increases.
* **Optimal (Δ) (Black):** The final error increases slightly with regularization. It starts at approximately 0.145 x 10<sup>-1</sup> and ends at approximately 0.16 x 10<sup>-1</sup>.
* **Optimal (Δ and η) (Green):** The final error decreases initially and then slightly increases with regularization. It has a minimum value of approximately 0.10 x 10<sup>-1</sup> around λ = 0.15.
**Plot b) Optimal Learning Rate vs Training Time:**
* **Optimal Learning Rate (Green):** The learning rate starts at approximately 4.25, increases to a peak of approximately 4.9 around α = 2, and then decreases rapidly until α = 6. At α = 6, there is a sharp drop in the learning rate from approximately 2.3 to 1.3. After this drop, the learning rate continues to decrease gradually, reaching approximately 1.0 at α = 12.
### Key Observations
* In plot a), the "Optimal (Δ and η)" method consistently achieves the lowest final error across all regularization values.
* In plot b), the optimal learning rate decreases over time, with a significant drop at the transition from the "Easy" to the "Hard" training phase.
### Interpretation
The plots suggest that incorporating both Δ and η in the optimization process leads to better performance (lower final error) compared to other methods. The optimal learning rate plot indicates that a higher learning rate is beneficial during the initial "Easy" phase of training, but it needs to be reduced significantly as the training progresses into the "Hard" phase. The sharp drop in the learning rate at the transition point suggests a deliberate adjustment to prevent overshooting or instability as the model encounters more complex data.