\n
## Diagram: Effects of Multiple Genetic Variants
### Overview
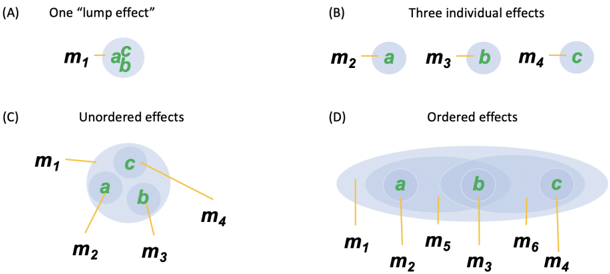
The image presents a diagram illustrating four different scenarios for the effects of multiple genetic variants (m1, m2, m3, m4, m5, m6) on a trait. Each scenario (A, B, C, D) is represented visually using overlapping circles, with the letters 'a', 'b', and 'c' representing individual effects within those variants. The diagram aims to demonstrate how the combined effect of multiple variants can manifest in different ways.
### Components/Axes
The diagram consists of four panels labeled (A) through (D). Each panel depicts a different model of genetic effect. The panels are arranged in a 2x2 grid. Each panel contains circles representing genetic variants and letters within the circles representing individual effects. Lines connect the circles to the variant labels (m1, m2, m3, m4, m5, m6).
### Detailed Analysis or Content Details
**Panel A: One "lump effect"**
* A single large, light blue circle labeled "m1" encompasses three smaller green circles labeled "a", "b", and "c".
* This suggests that the effects 'a', 'b', and 'c' are all part of a single, combined effect associated with variant m1.
**Panel B: Three individual effects**
* Four separate, light blue circles are labeled "m2", "m3", "m4", and "m5".
* Each circle contains a single green circle labeled "a", "b", and "c" respectively.
* This indicates that each effect ('a', 'b', 'c') is associated with a distinct variant (m2, m3, m4).
**Panel C: Unordered effects**
* A large, light blue circle labeled "m1" contains three smaller green circles labeled "a", "b", and "c".
* Lines connect the green circles to variant labels "m2", "m3", and "m4".
* This suggests that the effects 'a', 'b', and 'c' are associated with variant m1, but also have connections to variants m2, m3, and m4. The connections are not ordered.
**Panel D: Ordered effects**
* Overlapping light blue circles are labeled "m1", "m2", "m3", "m4", "m5", and "m6".
* Three green circles labeled "a", "b", and "c" are positioned within the overlapping regions.
* Lines connect the green circles to variant labels "m1", "m2", "m3", "m4".
* This indicates that the effects 'a', 'b', and 'c' are associated with multiple variants (m1, m2, m3, m4) in an ordered or overlapping manner.
### Key Observations
* The size and arrangement of the circles vary significantly across the panels, reflecting different models of genetic effect.
* The use of overlapping circles in panels C and D suggests interactions or shared effects between variants.
* The lines connecting the green circles to the variant labels emphasize the association between individual effects and specific variants.
### Interpretation
The diagram illustrates different ways in which multiple genetic variants can contribute to a trait. Panel A represents a scenario where multiple effects are bundled into a single variant. Panel B shows independent effects of each variant. Panel C suggests that effects can be associated with multiple variants in an unordered fashion, while Panel D demonstrates an ordered or overlapping relationship between effects and variants. The diagram highlights the complexity of genetic effects and the importance of considering interactions between variants when studying complex traits. The diagram does not provide quantitative data, but rather a qualitative representation of different genetic models. It is a conceptual illustration rather than a data-driven analysis.