## Line Graphs: Comparison of TurboQuantProd and EDEN-unbiased Algorithms
### Overview
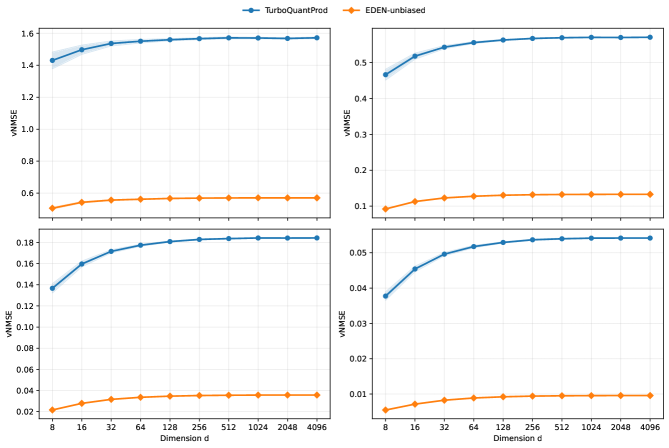
The image contains four line graphs arranged in a 2x2 grid, comparing the performance of two algorithms (**TurboQuantProd** and **EDEN-unbiased**) across varying dimensions (`d`). The y-axis measures **vNMSE** (variance-normalized mean squared error), while the x-axis represents computational dimensions (8, 16, 32, ..., 4096). Each graph uses distinct y-axis scales to emphasize performance differences.
---
### Components/Axes
1. **Legends**:
- **Top-right** of each graph:
- **Blue line**: TurboQuantProd
- **Orange line**: EDEN-unbiased
2. **Axes**:
- **X-axis (Horizontal)**:
- Label: "Dimension d"
- Values: 8, 16, 32, 64, 128, 256, 512, 1024, 2048, 4096 (logarithmic spacing).
- **Y-axis (Vertical)**:
- Label: "vNMSE"
- Scales vary per graph:
- Top-left: 0.6–1.6
- Top-right: 0.1–0.5
- Bottom-left: 0.02–0.18
- Bottom-right: 0.01–0.05
---
### Detailed Analysis
#### Top-Left Graph (Scale: 0.6–1.6)
- **TurboQuantProd (Blue)**:
- Starts at ~1.4 (dimension 8), rises to ~1.6 by dimension 16, then plateaus.
- Trend: Slight upward slope initially, then flat.
- **EDEN-unbiased (Orange)**:
- Starts at ~0.5 (dimension 8), rises to ~0.6 by dimension 16, then plateaus.
- Trend: Slight upward slope initially, then flat.
#### Top-Right Graph (Scale: 0.1–0.5)
- **TurboQuantProd (Blue)**:
- Starts at ~0.45 (dimension 8), rises to ~0.5 by dimension 16, then plateaus.
- Trend: Slight upward slope initially, then flat.
- **EDEN-unbiased (Orange)**:
- Starts at ~0.1 (dimension 8), rises to ~0.15 by dimension 16, then plateaus.
- Trend: Slight upward slope initially, then flat.
#### Bottom-Left Graph (Scale: 0.02–0.18)
- **TurboQuantProd (Blue)**:
- Starts at ~0.14 (dimension 8), rises to ~0.18 by dimension 16, then plateaus.
- Trend: Slight upward slope initially, then flat.
- **EDEN-unbiased (Orange)**:
- Starts at ~0.02 (dimension 8), rises to ~0.04 by dimension 16, then plateaus.
- Trend: Slight upward slope initially, then flat.
#### Bottom-Right Graph (Scale: 0.01–0.05)
- **TurboQuantProd (Blue)**:
- Starts at ~0.04 (dimension 8), rises to ~0.05 by dimension 16, then plateaus.
- Trend: Slight upward slope initially, then flat.
- **EDEN-unbiased (Orange)**:
- Starts at ~0.01 (dimension 8), rises to ~0.02 by dimension 16, then plateaus.
- Trend: Slight upward slope initially, then flat.
---
### Key Observations
1. **Consistent Performance Gap**:
- TurboQuantProd consistently exhibits **higher vNMSE** than EDEN-unbiased across all dimensions and scales.
- Example: At dimension 4096, TurboQuantProd’s vNMSE is ~1.6 (top-left) vs. EDEN-unbiased’s ~0.6.
2. **Scalability**:
- Both algorithms show minimal performance degradation as dimension increases, but TurboQuantProd’s error grows more noticeably in higher-scale graphs.
3. **Y-Axis Variability**:
- The differing y-axis ranges suggest the graphs represent distinct metrics or scenarios (e.g., different problem types or error normalization methods).
---
### Interpretation
- **Algorithm Efficiency**:
EDEN-unbiased demonstrates superior accuracy (lower vNMSE) across all tested dimensions, suggesting it is more robust or optimized for the tasks measured.
- **TurboQuantProd Limitations**:
Its higher error rates, especially in higher-dimensional spaces (e.g., 1024–4096), may indicate inefficiencies in handling complexity or overfitting.
- **Practical Implications**:
EDEN-unbiased could be preferred for applications requiring precision at scale, while TurboQuantProd might suffice for simpler, lower-dimensional tasks.
- **Unresolved Questions**:
The differing y-axis scales across graphs warrant clarification—are these separate experiments, or is vNMSE normalized differently?
---
### Spatial Grounding & Verification
- **Legend Placement**: Top-right of each graph, ensuring clarity.
- **Color Consistency**: Blue = TurboQuantProd, Orange = EDEN-unbiased (confirmed across all graphs).
- **Axis Labels**: Explicitly labeled "Dimension d" and "vNMSE" in all cases.
---
### Conclusion
The data underscores EDEN-unbiased’s superiority in minimizing error across computational dimensions, with TurboQuantProd showing diminishing returns as complexity increases. Further investigation into the y-axis normalization and experimental conditions is recommended to contextualize these results.