## Line Chart: AI Model Benchmark Performance Comparison
### Overview
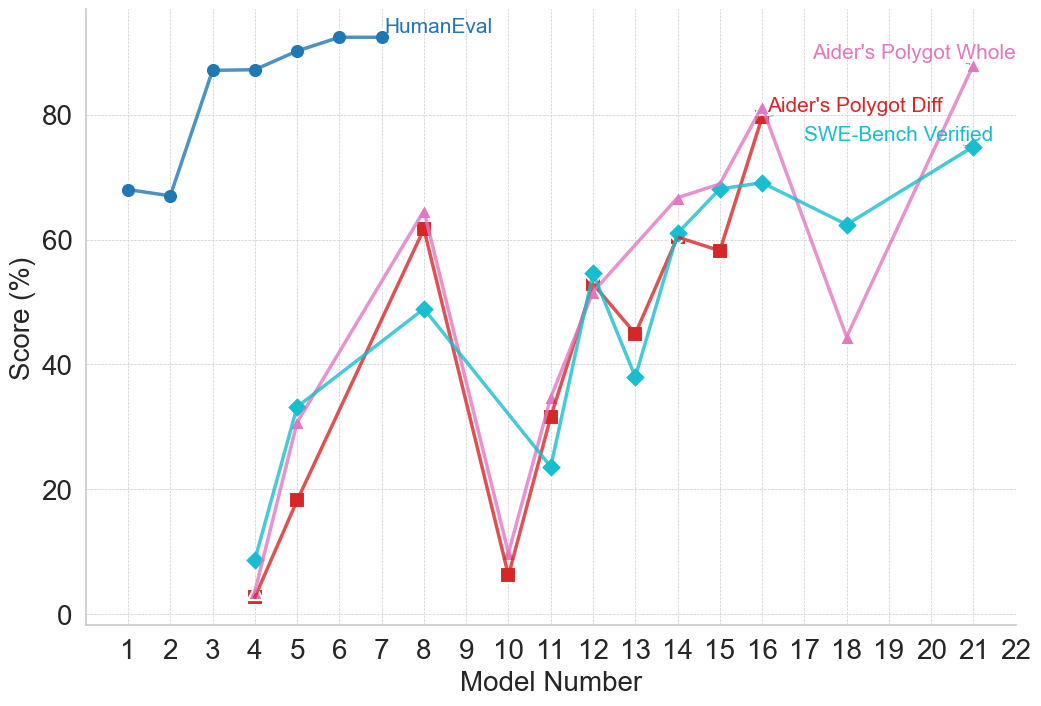
This image is a line chart comparing the performance scores (in percentage) of various AI models across four different benchmark datasets. The chart plots "Score (%)" on the vertical axis against "Model Number" on the horizontal axis, showing how different models perform on each benchmark.
### Components/Axes
* **Chart Type:** Multi-series line chart with markers.
* **X-Axis (Horizontal):**
* **Label:** "Model Number"
* **Scale:** Linear, discrete integers from 1 to 22.
* **Y-Axis (Vertical):**
* **Label:** "Score (%)"
* **Scale:** Linear, from 0 to 80, with major gridlines at intervals of 20 (0, 20, 40, 60, 80).
* **Legend:** Located in the top-right quadrant of the chart area. It contains four entries:
1. **HumanEval** - Represented by a blue line with circle markers.
2. **Aider's Polygot Whole** - Represented by a pink line with upward-pointing triangle markers.
3. **Aider's Polygot Diff** - Represented by a red line with square markers.
4. **SWE-Bench Verified** - Represented by a cyan/turquoise line with diamond markers.
* **Grid:** Light gray horizontal gridlines are present at each major y-axis tick (0, 20, 40, 60, 80).
### Detailed Analysis
**1. HumanEval (Blue Line, Circle Markers):**
* **Trend:** Starts high, shows a slight dip, then rises sharply and plateaus at a high level.
* **Data Points (Approximate):**
* Model 1: ~68%
* Model 2: ~67%
* Model 3: ~87%
* Model 4: ~87%
* Model 5: ~90%
* Model 6: ~92%
* Model 7: ~92%
* Model 8: ~92% (line ends here)
* **Note:** This series only has data points from Model 1 to Model 8.
**2. Aider's Polygot Whole (Pink Line, Triangle Markers):**
* **Trend:** Highly volatile. Starts very low, spikes, crashes, then shows a general upward trend with significant fluctuations.
* **Data Points (Approximate):**
* Model 4: ~3%
* Model 5: ~31%
* Model 8: ~64%
* Model 10: ~9%
* Model 11: ~34%
* Model 12: ~52%
* Model 14: ~66%
* Model 16: ~80%
* Model 18: ~44%
* Model 21: ~88% (highest point on the entire chart)
**3. Aider's Polygot Diff (Red Line, Square Markers):**
* **Trend:** Follows a very similar volatile pattern to "Aider's Polygot Whole," often slightly below it.
* **Data Points (Approximate):**
* Model 4: ~2%
* Model 5: ~19%
* Model 8: ~62%
* Model 10: ~7%
* Model 11: ~32%
* Model 12: ~54%
* Model 13: ~45%
* Model 14: ~61%
* Model 15: ~59%
* Model 16: ~79%
**4. SWE-Bench Verified (Cyan Line, Diamond Markers):**
* **Trend:** Starts low, shows a more consistent upward trend compared to the "Aider" benchmarks, with a notable dip around Model 13.
* **Data Points (Approximate):**
* Model 4: ~9%
* Model 5: ~33%
* Model 8: ~49%
* Model 11: ~24%
* Model 12: ~55%
* Model 13: ~38%
* Model 14: ~61%
* Model 15: ~68%
* Model 16: ~69%
* Model 18: ~62%
* Model 21: ~75%
### Key Observations
1. **Benchmark Disparity:** There is a massive performance gap between the "HumanEval" benchmark (consistently scoring >65% for models 3-8) and the other three benchmarks for the early model numbers (1-8).
2. **Correlated Volatility:** The "Aider's Polygot Whole" and "Aider's Polygot Diff" lines are tightly correlated in their movements, suggesting these two benchmarks measure similar capabilities or are affected similarly by model changes.
3. **Critical Dip at Model 10:** All three volatile benchmarks (Aider Whole, Aider Diff, SWE-Bench) show a severe performance drop at Model 10, with scores falling to single digits or low teens.
4. **General Upward Trend:** Despite volatility, the overall trajectory for the three non-HumanEval benchmarks is upward from Model 4 to Model 21.
5. **Peak Performance:** The highest recorded score on the chart is for "Aider's Polygot Whole" at Model 21 (~88%). The highest for "SWE-Bench Verified" is at Model 21 (~75%), and for "Aider's Polygot Diff" at Model 16 (~79%).
### Interpretation
This chart visualizes the progression and specialization of AI coding models. The "HumanEval" benchmark, likely a foundational code generation test, is mastered early (by Model 3) and shows a performance plateau, suggesting it may be a less discriminative test for newer, more advanced models.
In contrast, the "Aider" and "SWE-Bench" benchmarks appear to be more challenging and complex, possibly testing real-world software engineering tasks like code refactoring (Diff), full-file editing (Whole), or issue resolution (SWE-Bench). The high volatility and the dramatic dip at Model 10 indicate that performance on these tasks is highly sensitive to specific model architectures or training data. The general upward trend, however, demonstrates that subsequent models are increasingly capable of handling these complex, practical coding challenges. The strong correlation between the two "Aider" metrics suggests they are robust and consistent measures of a related skill set. The chart effectively argues that while basic code generation is a solved problem for modern models, advanced software engineering proficiency is the current frontier with significant room for improvement and variation.