## Multi-Panel Bar Chart: Final-Round Accuracy Across Experimental Conditions
### Overview
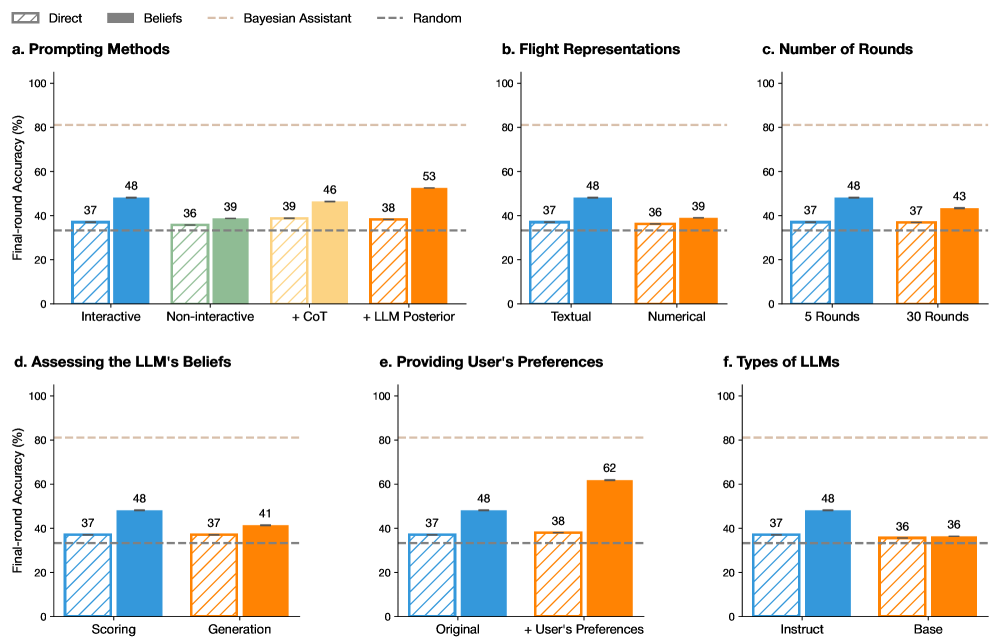
The image displays a set of six bar charts (labeled a through f) comparing the "Final-round Accuracy (%)" of different methods or conditions in what appears to be a study on Large Language Model (LLM) performance, likely in a Bayesian or interactive reasoning task. Each subplot compares two primary conditions ("Direct" and "Beliefs") across different experimental variables. Two horizontal dashed lines serve as baselines across all charts.
### Components/Axes
* **Global Y-Axis:** "Final-round Accuracy (%)" with a scale from 0 to 100, marked at intervals of 20 (0, 20, 40, 60, 80, 100).
* **Global Legend (Top Center):**
* **Direct:** Represented by striped bars.
* **Beliefs:** Represented by solid-colored bars.
* **Bayesian Assistant:** A horizontal dashed line in light brown/tan, positioned at approximately 80% accuracy.
* **Random:** A horizontal dashed line in dark gray, positioned at approximately 33% accuracy.
* **Subplot Titles:**
* a. Prompting Methods
* b. Flight Representations
* c. Number of Rounds
* d. Assessing the LLM's Beliefs
* e. Providing User's Preferences
* f. Types of LLMs
* **X-Axis Categories:** Each subplot has two primary categories on its x-axis, with each category containing a pair of bars (Direct and Beliefs).
### Detailed Analysis
**Subplot a. Prompting Methods**
* **Categories:** "Interactive" and "Non-interactive".
* **Data Points:**
* Interactive: Direct = 37%, Beliefs = 48% (Blue bars).
* Non-interactive: Direct = 36%, Beliefs = 39% (Green bars).
* **Trend:** The "Beliefs" condition outperforms "Direct" in both cases, with a larger gain in the Interactive setting.
**Subplot b. Flight Representations**
* **Categories:** "Textual" and "Numerical".
* **Data Points:**
* Textual: Direct = 37%, Beliefs = 48% (Blue bars).
* Numerical: Direct = 36%, Beliefs = 39% (Orange bars).
* **Trend:** Similar pattern to subplot (a). The "Beliefs" condition shows a significant improvement with Textual representation.
**Subplot c. Number of Rounds**
* **Categories:** "5 Rounds" and "30 Rounds".
* **Data Points:**
* 5 Rounds: Direct = 37%, Beliefs = 48% (Blue bars).
* 30 Rounds: Direct = 37%, Beliefs = 43% (Orange bars).
* **Trend:** Accuracy for the "Beliefs" condition is higher with fewer rounds (5 vs. 30).
**Subplot d. Assessing the LLM's Beliefs**
* **Categories:** "Scoring" and "Generation".
* **Data Points:**
* Scoring: Direct = 37%, Beliefs = 48% (Blue bars).
* Generation: Direct = 37%, Beliefs = 41% (Orange bars).
* **Trend:** The "Beliefs" condition yields higher accuracy when assessed via "Scoring" compared to "Generation".
**Subplot e. Providing User's Preferences**
* **Categories:** "Original" and "+ User's Preferences".
* **Data Points:**
* Original: Direct = 37%, Beliefs = 48% (Blue bars).
* + User's Preferences: Direct = 38%, Beliefs = 62% (Orange bars).
* **Trend:** This subplot shows the most dramatic improvement. Adding user preferences boosts the "Beliefs" condition accuracy to 62%, the highest value across all charts.
**Subplot f. Types of LLMs**
* **Categories:** "Instruct" and "Base".
* **Data Points:**
* Instruct: Direct = 37%, Beliefs = 48% (Blue bars).
* Base: Direct = 36%, Beliefs = 36% (Orange bars).
* **Trend:** The "Beliefs" condition provides a substantial benefit for the "Instruct" model type but no benefit for the "Base" model type.
### Key Observations
1. **Consistent Baseline:** The "Direct" method (striped bars) shows remarkably consistent accuracy, hovering between 36-38% across all conditions, closely aligning with the "Random" baseline (~33%).
2. **Beliefs Condition Impact:** The "Beliefs" condition (solid bars) universally improves upon the "Direct" method, except for the "Base" LLM type in subplot (f), where both are equal at 36%.
3. **Peak Performance:** The highest observed accuracy (62%) is achieved in subplot (e) under the "+ User's Preferences" condition using the "Beliefs" method.
4. **Bayesian Assistant Benchmark:** The "Bayesian Assistant" baseline (~80%) remains significantly above the performance of all tested LLM conditions, indicating a substantial gap between the model's performance and this theoretical or ideal benchmark.
5. **Color Coding:** The bar colors are consistent across subplots for the same experimental variable (e.g., blue for Interactive/Textual/5 Rounds/Scoring/Original/Instruct), aiding visual comparison.
### Interpretation
The data suggests that explicitly modeling or incorporating the LLM's "Beliefs" into the prompting or reasoning process ("Beliefs" condition) consistently improves final-round accuracy compared to a "Direct" prompting approach. This improvement is robust across various factors like interactivity, data representation, and assessment method.
The most significant finding is the powerful synergistic effect of combining the "Beliefs" approach with the provision of user preferences (subplot e), which yields the highest accuracy. This implies that tailoring the interaction to align with user-specific goals or biases greatly enhances the model's performance in this task.
However, the benefit of the "Beliefs" approach is not universal; it fails to improve performance for the "Base" LLM (subplot f), suggesting that the model's underlying architecture or training (Instruct vs. Base) is a critical factor for this method to be effective. The consistent underperformance relative to the "Bayesian Assistant" benchmark highlights room for improvement in LLM-based reasoning systems. The charts collectively argue for the value of belief-aware and user-aware prompting strategies in complex reasoning tasks.