## Diagram: Simple Directed Graphs
### Overview
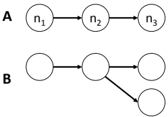
The image presents two simple directed graphs, labeled A and B. Each graph consists of nodes (represented as circles) connected by directed edges (arrows). Graph A is a linear chain of three nodes, while Graph B shows a branching structure.
### Components/Axes
* **Nodes:** Represented by circles. In graph A, the nodes are labeled n1, n2, and n3. Graph B has unlabeled nodes.
* **Edges:** Represented by arrows, indicating the direction of the relationship between nodes.
* **Labels:** "A" and "B" are labels identifying the two graphs.
### Detailed Analysis or ### Content Details
* **Graph A:**
* Nodes: n1, n2, n3
* Edges: n1 -> n2, n2 -> n3
* Trend: A simple linear sequence.
* **Graph B:**
* Nodes: Three unlabeled nodes.
* Edges: Node1 -> Node2, Node2 -> Node3, Node2 -> Node4
* Trend: A branching structure where one node has two outgoing edges.
### Key Observations
* Graph A represents a simple linear progression.
* Graph B represents a branching or diverging relationship.
* The nodes in Graph B are not labeled, unlike Graph A.
### Interpretation
The diagram illustrates two fundamental types of directed graphs: a linear sequence and a branching structure. These structures are commonly used to represent processes, relationships, or dependencies in various fields, such as computer science, biology, and social sciences. The presence of labels in Graph A suggests a specific order or identity for the nodes, while the absence of labels in Graph B implies a more general or abstract relationship.