\n
## Diagram: Network Flow Representations
### Overview
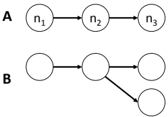
The image presents two diagrams, labeled 'A' and 'B', illustrating different network flow structures. Both diagrams use nodes connected by directed arrows to represent the flow. Diagram A shows a linear, sequential flow, while Diagram B depicts a branching flow.
### Components/Axes
The diagrams consist of nodes (circles) and directed edges (arrows).
- **Diagram A:** Contains three nodes labeled n1, n2, and n3. Arrows point from n1 to n2, and from n2 to n3.
- **Diagram B:** Contains four nodes. Arrows point from the first node to the second, from the second to the third, and from the second to the fourth.
### Detailed Analysis or Content Details
**Diagram A:**
- Node n1 is positioned on the left.
- Node n2 is positioned in the center.
- Node n3 is positioned on the right.
- The flow proceeds linearly from n1 -> n2 -> n3.
**Diagram B:**
- The first node is positioned on the left.
- The second node is positioned in the center.
- The third node is positioned on the right.
- The fourth node is positioned below the second node.
- The flow splits from the second node, going to both the third and fourth nodes.
### Key Observations
- Diagram A represents a simple, unidirectional flow through a series of nodes.
- Diagram B represents a flow that diverges, indicating a branching or decision point.
- The diagrams do not contain any numerical data or scales. They are purely structural representations.
### Interpretation
The diagrams likely represent simplified models of processes or systems where elements are connected by directional relationships. Diagram A could represent a sequential process, like a manufacturing line, or a simple chain of events. Diagram B could represent a decision tree, a network with multiple pathways, or a system where a single input can lead to multiple outputs. The absence of quantitative data suggests the diagrams are intended to illustrate the *structure* of the flow rather than its magnitude or rate. The diagrams are conceptual and do not provide specific data points for analysis. They are illustrative examples of network topologies.