## Line Chart: Energy Difference vs. Beta
### Overview
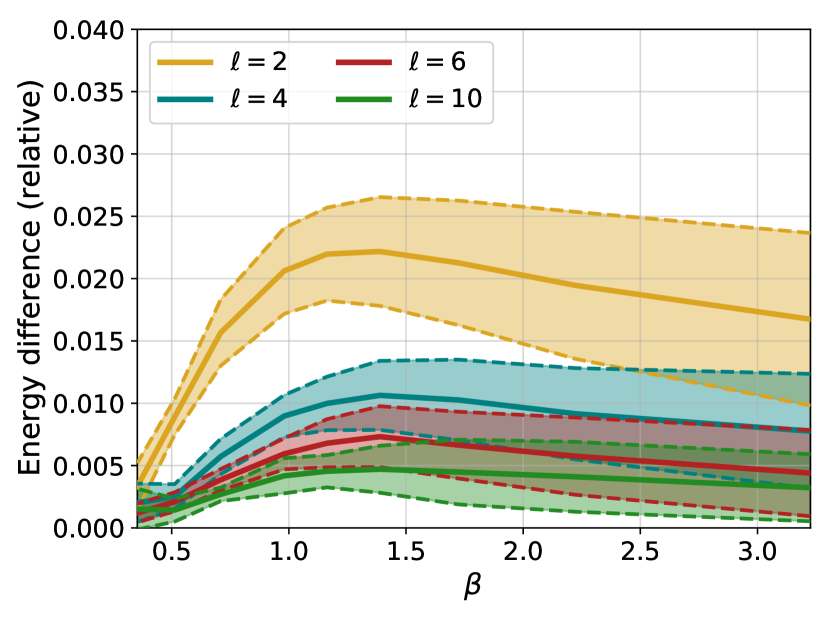
The image presents a line chart illustrating the relationship between energy difference (relative) and a parameter denoted as β (beta). The chart displays four lines, each representing a different value of 'l' (2, 4, 6, and 10). Each line is accompanied by a shaded region, likely representing a confidence interval or standard deviation.
### Components/Axes
* **X-axis:** Labeled "β" (beta), ranging from approximately 0.3 to 3.2. The scale is linear.
* **Y-axis:** Labeled "Energy difference (relative)", ranging from 0.000 to 0.040. The scale is linear.
* **Legend:** Located in the top-right corner of the chart. It maps colors to the 'l' values:
* Yellow: l = 2
* Teal: l = 4
* Maroon: l = 6
* Green: l = 10
* **Gridlines:** A grid is present, aiding in the reading of values.
### Detailed Analysis
The chart shows the energy difference as a function of β for different values of l. Each line represents the mean energy difference, and the shaded area around each line represents the uncertainty.
* **l = 2 (Yellow):** The line starts at approximately 0.002 at β = 0.3, then rapidly increases to approximately 0.028 at β = 1.0. It continues to increase, reaching approximately 0.035 at β = 3.0. The shaded region indicates a relatively large uncertainty, especially at higher β values.
* **l = 4 (Teal):** The line begins at approximately 0.001 at β = 0.3, increases to approximately 0.012 at β = 1.0, and plateaus around 0.015 at β = 3.0. The shaded region is smaller than that of l = 2, suggesting lower uncertainty.
* **l = 6 (Maroon):** The line starts at approximately 0.0005 at β = 0.3, increases to approximately 0.008 at β = 1.0, and plateaus around 0.010 at β = 3.0. The shaded region is relatively small.
* **l = 10 (Green):** The line starts at approximately 0.0005 at β = 0.3, increases to approximately 0.006 at β = 1.0, and plateaus around 0.007 at β = 3.0. The shaded region is the smallest, indicating the lowest uncertainty.
All lines exhibit an initial increase in energy difference as β increases, followed by a plateau. The rate of increase and the plateau value depend on the value of 'l'.
### Key Observations
* The energy difference increases more rapidly with β for smaller values of 'l' (2 and 4).
* As 'l' increases (6 and 10), the energy difference remains relatively low and plateaus quickly.
* The uncertainty (represented by the shaded regions) is largest for l = 2 and smallest for l = 10.
* All lines converge towards a similar energy difference value as β approaches 3.0.
### Interpretation
The data suggests that the energy difference is sensitive to the parameter β, particularly for lower values of 'l'. As 'l' increases, the system becomes less sensitive to changes in β, and the energy difference stabilizes. The uncertainty associated with the energy difference decreases as 'l' increases, indicating a more stable and predictable system.
The plateau observed for higher values of 'l' suggests that there is a limit to the energy difference that can be achieved, regardless of the value of β. This could be due to saturation effects or other physical constraints within the system. The convergence of the lines at high β values indicates that the system's behavior becomes independent of 'l' under those conditions.
The parameter 'l' likely represents a physical property of the system, such as a length scale or a quantum number. The parameter β could represent an external field or a control parameter. The chart provides insights into how the energy of the system responds to changes in β, depending on the value of 'l'.