\n
## Diagram: Pipeline Stage Breakdown - Computation and Communication
### Overview
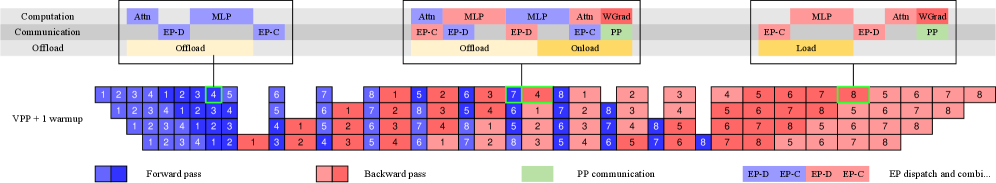
The image presents a diagram illustrating the breakdown of computation and communication stages within a pipeline, likely related to a deep learning model. It compares different offloading and dispatch strategies (EP-D, EP-C, PP) for Attention (Attn), Multi-Layer Perceptron (MLP), and Weight Gradient (WGrad) operations. The diagram visualizes the stages across a timeline, represented by numbered blocks, differentiating between forward and backward passes.
### Components/Axes
The diagram is structured into three main sections, each representing a different configuration of computation and communication:
* **Section 1 (Left):** Attn and MLP, both using EP-D and EP-C offload strategies.
* **Section 2 (Center):** Attn, MLP, and WGrad, with Attn and WGrad using PP communication and MLP using EP-D offload. This section is labeled "Onload".
* **Section 3 (Right):** MLP and WGrad, both using EP-C and EP-D dispatch strategies, and labeled "Load".
The horizontal axis represents time steps, labeled "VPP + 1 warmup" and numbered 1 through 8.
A legend at the bottom-right clarifies the color coding:
* **Blue:** Forward pass
* **Red:** Backward pass
* **Green:** PP communication
* **Yellow:** EP dispatch and combi.
The top section labels the type of computation and communication strategy used in each section.
### Detailed Analysis or Content Details
Let's analyze each section and its corresponding timeline:
**Section 1 (Attn & MLP - EP-D/EP-C Offload):**
* **Attn (EP-D):** Blocks 1-4 are primarily blue (forward pass), with block 4 having a yellow overlay (EP dispatch and combi.).
* **MLP (EP-C):** Blocks 1-4 are primarily red (backward pass), with block 4 having a yellow overlay.
* **Attn (EP-C):** Blocks 5-8 are primarily red (backward pass), with block 5 having a yellow overlay.
* **MLP (EP-D):** Blocks 5-8 are primarily blue (forward pass), with block 5 having a yellow overlay.
**Section 2 (Attn, MLP, WGrad - PP/EP-D):**
* **Attn (PP):** Blocks 1-4 are primarily red (backward pass), with block 4 having a green overlay (PP communication).
* **MLP (EP-D):** Blocks 1-4 are primarily blue (forward pass), with block 4 having a yellow overlay.
* **MLP (EP-D):** Blocks 5-8 are primarily red (backward pass), with block 5 having a yellow overlay.
* **Attn (PP):** Blocks 5-8 are primarily blue (forward pass), with block 5 having a green overlay.
* **WGrad (PP):** Block 1 is blue (forward pass), block 2 is red (backward pass).
**Section 3 (MLP & WGrad - EP-C/EP-D Load):**
* **MLP (EP-C):** Blocks 1-4 are primarily red (backward pass), with block 4 having a yellow overlay.
* **WGrad (EP-D):** Blocks 1-4 are primarily blue (forward pass), with block 4 having a yellow overlay.
* **MLP (EP-D):** Blocks 5-8 are primarily blue (forward pass), with block 5 having a yellow overlay.
* **WGrad (EP-C):** Blocks 5-8 are primarily red (backward pass), with block 5 having a yellow overlay.
### Key Observations
* The diagram highlights the alternating pattern of forward and backward passes across the timeline.
* The use of yellow overlays indicates the presence of EP dispatch and combination operations, often coinciding with the end of a forward or backward pass.
* PP communication (green) appears to be concentrated in specific blocks, particularly in the Attn and WGrad sections of the "Onload" configuration.
* The "Offload" sections (left) show a more balanced distribution of forward and backward passes, while the "Load" section (right) appears to have a more staggered pattern.
### Interpretation
This diagram likely represents a performance comparison of different strategies for distributing the computational workload of a neural network across multiple devices (e.g., CPU and GPU). The EP-D, EP-C, and PP labels likely refer to different execution paradigms or communication protocols.
* **EP-D and EP-C** likely represent different forms of Early Processing with different dispatch strategies.
* **PP** likely represents Pipeline Parallelism, where different stages of the network are executed on different devices concurrently.
The diagram suggests that the choice of offloading and dispatch strategy can significantly impact the timing and balance of forward and backward passes. The presence of PP communication indicates that data needs to be transferred between devices during pipeline execution. The "Load" configuration might represent a scenario where the entire model is loaded onto a single device, while the "Offload" configurations represent scenarios where parts of the model are offloaded to other devices.
The diagram is a visual aid for understanding the trade-offs between different execution strategies and optimizing the performance of a distributed deep learning system. The "warmup" phase suggests that the initial stages of the pipeline might require some overhead to initialize the system.