## Diagram: State Transition Diagram with Clustering
### Overview
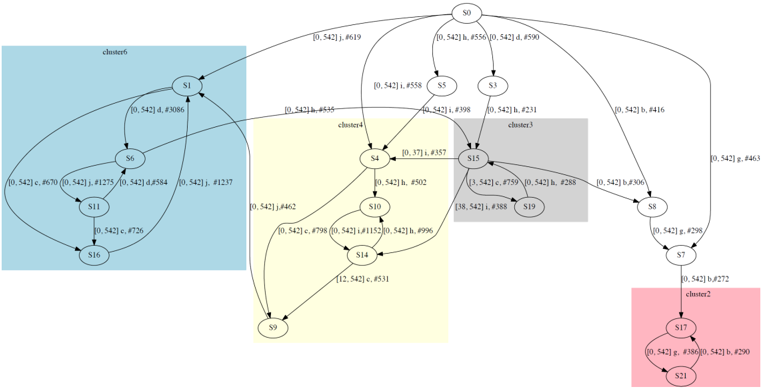
The image depicts a state transition diagram with nodes representing states (labeled S0 through S21) and directed edges representing transitions between states. The diagram is visually organized into four distinct clusters, highlighted with different background colors: light blue (cluster6), pale yellow (cluster4), gray (cluster3), and light red (cluster2). Each transition edge is labeled with a tuple of the form `(probability, uncertainty)`.
### Components/Axes
The diagram consists of:
* **Nodes:** Represented by circles labeled S0 to S21.
* **Edges:** Directed arrows connecting the nodes, labeled with probability and uncertainty values.
* **Clusters:** Colored regions grouping related states.
* Cluster 2 (Light Red)
* Cluster 3 (Gray)
* Cluster 4 (Pale Yellow)
* Cluster 6 (Light Blue)
* **Labels:** State labels (S0-S21), edge labels (probability, uncertainty), and cluster labels (cluster2, cluster3, cluster4, cluster6).
### Detailed Analysis
**Cluster 2 (Light Red - Bottom Right):**
* S17 transitions to S21 with a probability of approximately 0.542 and an uncertainty of 272.
* S21 transitions to S17 with a probability of approximately 0.542 and an uncertainty of 290.
**Cluster 3 (Gray - Center Right):**
* S3 transitions to S15 with a probability of approximately 0.542 and an uncertainty of 231.
* S8 transitions to S15 with a probability of approximately 0.542 and an uncertainty of 3306.
* S15 transitions to S3 with a probability of approximately 0.542 and an uncertainty of 759.
* S15 transitions to S8 with a probability of approximately 0.542 and an uncertainty of 928.
* S15 transitions to S10 with a probability of approximately 0.888 and an uncertainty of 38.
**Cluster 4 (Pale Yellow - Center):**
* S0 transitions to S5 with a probability of approximately 0.542 and an uncertainty of 4556.
* S0 transitions to S3 with a probability of approximately 0.542 and an uncertainty of 490.
* S5 transitions to S15 with a probability of approximately 0.542 and an uncertainty of 898.
* S4 transitions to S10 with a probability of approximately 0.37 and an uncertainty of 1357.
* S10 transitions to S9 with a probability of approximately 0.542 and an uncertainty of 4462.
* S10 transitions to S14 with a probability of approximately 1.11 and an uncertainty of 999.
* S14 transitions to S9 with a probability of approximately 12.542 and an uncertainty of 351.
* S9 transitions to S4 with a probability of approximately 0.542 and an uncertainty of 444.
**Cluster 6 (Light Blue - Left):**
* S1 transitions to S6 with a probability of approximately 0.542 and an uncertainty of 4670.
* S6 transitions to S11 with a probability of approximately 0.542 and an uncertainty of 1275.
* S11 transitions to S16 with a probability of approximately 0.542 and an uncertainty of 4584.
* S16 transitions to S11 with a probability of approximately 0.726 and an uncertainty of 26.
**Inter-Cluster Transitions:**
* S1 transitions to S0 with a probability of approximately 0.619 and an uncertainty of 0.
* S4 transitions to S5 with a probability of approximately 0.542 and an uncertainty of 888.
### Key Observations
* The probabilities are consistently around 0.542, suggesting a relatively uniform transition probability within most of the network.
* The uncertainty values vary significantly, ranging from 0 to 3306. This suggests varying degrees of confidence in the transition probabilities.
* Cluster 2 (S17, S21) is isolated, indicating a self-contained sub-system.
* S15 is a central node, receiving transitions from S3, S8, and S5, and transitioning to S3, S8, and S10.
* S10 is a hub within Cluster 4, receiving transitions from S4 and S14, and transitioning to S9 and S14.
### Interpretation
This diagram represents a Markov chain or a similar probabilistic state transition model. The clusters likely represent different functional modules or states of a system. The probabilities represent the likelihood of transitioning from one state to another. The high uncertainty values in some transitions suggest that these transitions are less predictable or based on less data.
The clustering suggests that the system can be decomposed into relatively independent sub-systems (e.g., Cluster 2). The central nodes (S15, S10) act as key intermediaries, connecting different parts of the system. The diagram could represent a variety of systems, such as a control system, a biological pathway, or a user interaction model. The consistent probability of 0.542 could indicate a balanced system or a simplification of a more complex model. The isolated cluster 2 could represent a stable state or a rarely accessed part of the system. The diagram provides a visual representation of the system's dynamics and potential pathways.