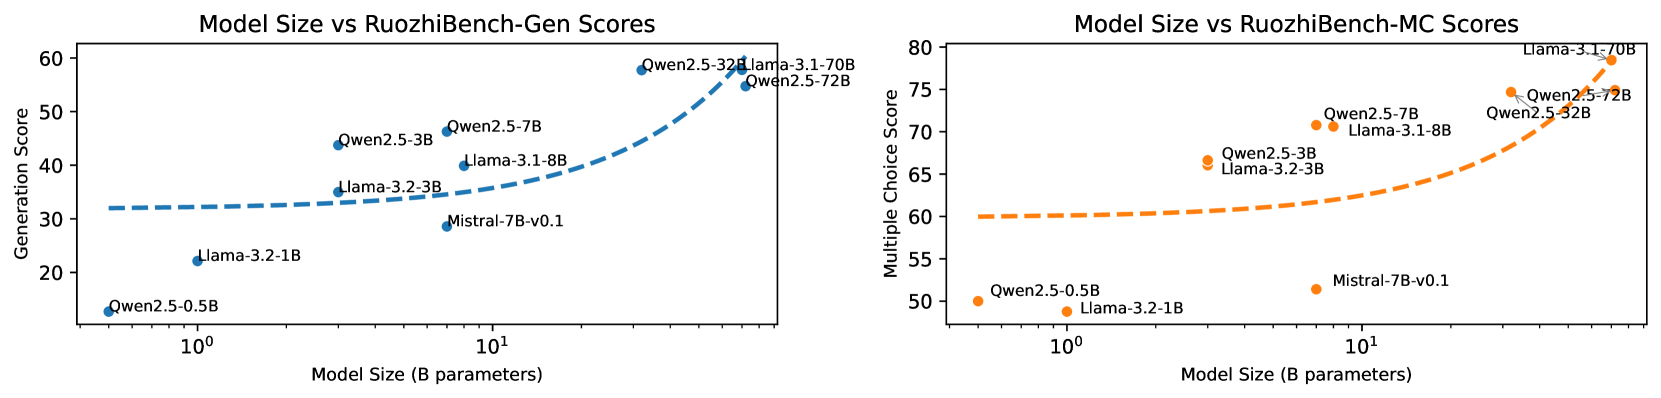
## Scatter Plot: Model Size vs RuozhiBench Scores
### Overview
The image contains two scatter plots comparing the model size (in billions of parameters) of various language models against their scores on two different RuozhiBench benchmarks: Generation (Gen) and Multiple Choice (MC). The x-axis (Model Size) is logarithmic. The left plot shows the relationship between model size and the Generation score, while the right plot shows the relationship between model size and the Multiple Choice score.
### Components/Axes
**Left Plot (Model Size vs RuozhiBench-Gen Scores):**
* **Title:** Model Size vs RuozhiBench-Gen Scores
* **X-axis:** Model Size (B parameters) - Logarithmic scale. Approximate values shown are 10^0 (1) and 10^1 (10).
* **Y-axis:** Generation Score - Linear scale, ranging from 20 to 60.
* **Data Points:** Blue dots, each labeled with the model name.
* **Trend Line:** Dashed blue line showing the general trend.
**Right Plot (Model Size vs RuozhiBench-MC Scores):**
* **Title:** Model Size vs RuozhiBench-MC Scores
* **X-axis:** Model Size (B parameters) - Logarithmic scale. Approximate values shown are 10^0 (1) and 10^1 (10).
* **Y-axis:** Multiple Choice Score - Linear scale, ranging from 50 to 80.
* **Data Points:** Orange dots, each labeled with the model name.
* **Trend Line:** Dashed orange line showing the general trend.
### Detailed Analysis
**Left Plot (Model Size vs RuozhiBench-Gen Scores):**
* **Qwen2.5-0.5B:** Model Size ~0.5B, Generation Score ~25
* **Llama-3.2-1B:** Model Size ~1B, Generation Score ~22
* **Mistral-7B-v0.1:** Model Size ~7B, Generation Score ~34
* **Llama-3.2-3B:** Model Size ~3B, Generation Score ~35
* **Qwen2.5-3B:** Model Size ~3B, Generation Score ~42
* **Llama-3.1-8B:** Model Size ~8B, Generation Score ~40
* **Qwen2.5-7B:** Model Size ~7B, Generation Score ~45
* **Qwen2.5-32B:** Model Size ~32B, Generation Score ~55
* **Qwen2.5-72B:** Model Size ~72B, Generation Score ~54
* **Llama-3.1-70B:** Model Size ~70B, Generation Score ~57
The Generation Score trend is generally increasing with model size, with a steeper increase for models larger than 7B parameters.
**Right Plot (Model Size vs RuozhiBench-MC Scores):**
* **Qwen2.5-0.5B:** Model Size ~0.5B, Multiple Choice Score ~50
* **Llama-3.2-1B:** Model Size ~1B, Multiple Choice Score ~48
* **Mistral-7B-v0.1:** Model Size ~7B, Multiple Choice Score ~52
* **Llama-3.2-3B:** Model Size ~3B, Multiple Choice Score ~64
* **Qwen2.5-3B:** Model Size ~3B, Multiple Choice Score ~69
* **Llama-3.1-8B:** Model Size ~8B, Multiple Choice Score ~70
* **Qwen2.5-7B:** Model Size ~7B, Multiple Choice Score ~71
* **Qwen2.5-32B:** Model Size ~32B, Multiple Choice Score ~74
* **Qwen2.5-72B:** Model Size ~72B, Multiple Choice Score ~75
* **Llama-3.1-70B:** Model Size ~70B, Multiple Choice Score ~78
The Multiple Choice Score trend is also generally increasing with model size, with a steeper increase for models larger than 7B parameters.
### Key Observations
* Both Generation and Multiple Choice scores tend to increase with model size.
* The increase in scores appears to be more pronounced for models with more than 7B parameters.
* There are some variations in performance among models of similar sizes.
### Interpretation
The plots suggest a positive correlation between model size and performance on both RuozhiBench-Gen and RuozhiBench-MC benchmarks. This indicates that larger models generally perform better on these tasks. However, the relationship is not strictly linear, as the rate of improvement seems to increase for larger models. The variations in performance among models of similar sizes suggest that other factors, such as model architecture and training data, also play a significant role in determining performance. The data highlights the trend that increasing model size is a viable strategy for improving performance, but it is not the only factor to consider.