## Composite Figure: Quantum Optics Experiment and Simulation Results
### Overview
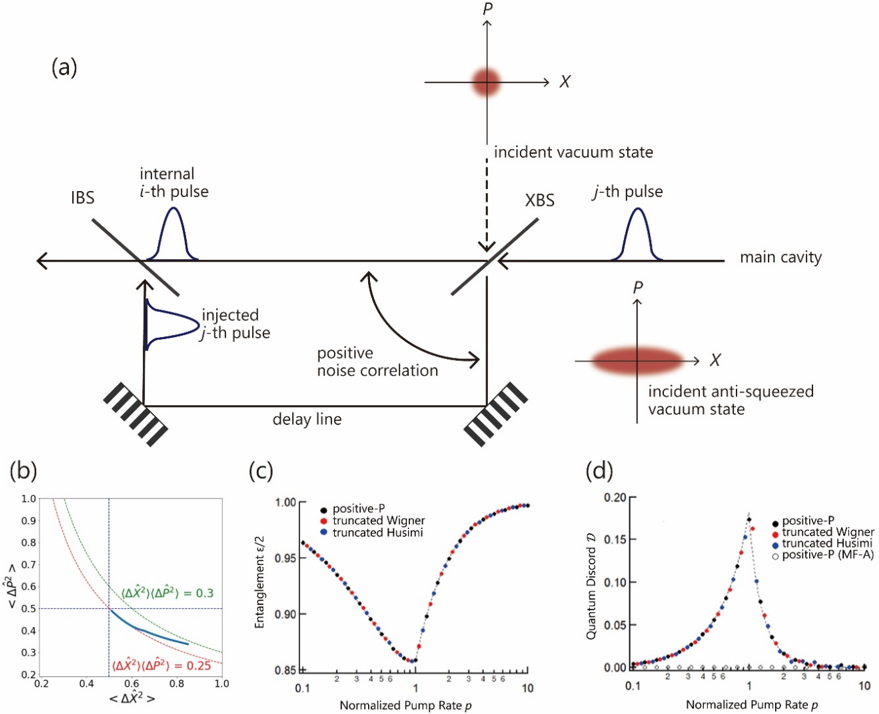
The image presents a composite figure comprising a schematic diagram of a quantum optics experiment and three plots comparing simulation results obtained using different theoretical approaches. The experiment involves interacting pulses in a main cavity, and the simulations explore entanglement and quantum discord as a function of normalized pump rate.
### Components/Axes
**Figure (a): Schematic Diagram**
* **Title:** None explicitly stated, but it represents the experimental setup.
* **Components:**
* IBS (Input Beam Splitter): Located on the top-left.
* XBS (Output Beam Splitter): Located on the top-right.
* Main Cavity: The central region where the pulses interact.
* Delay Line: At the bottom, connecting the output of IBS to the input of XBS.
* Mirrors: Represented by parallel lines.
* Pulses: "internal *i*-th pulse" and "injected *j*-th pulse" are shown as Gaussian-like curves.
* Incident vacuum state: Shown as a red circle at the top, with axes labeled P and X.
* Incident anti-squeezed vacuum state: Shown as a red ellipse at the bottom, with axes labeled P and X.
* Positive noise correlation: Indicated by a curved arrow.
**Figure (b): Plot of Variance Product**
* **X-axis:** `<ΔX²>` (Variance of X) - Ranges from 0.2 to 1.0.
* **Y-axis:** `<ΔP²>` (Variance of P) - Ranges from 0.2 to 1.0.
* **Curves:**
* `(ΔX²)(ΔP²) = 0.3`: Represented by a green dashed line.
* `(ΔX²)(ΔP²) = 0.25`: Represented by a blue line.
**Figure (c): Plot of Entanglement**
* **X-axis:** Normalized Pump Rate *p* - Logarithmic scale from 0.1 to 10.
* **Y-axis:** Entanglement ε/2 - Linear scale from 0.85 to 1.00.
* **Data Series (Legend - top-right):**
* positive-P: Black dots.
* truncated Wigner: Red dots.
* truncated Husimi: Blue dots.
**Figure (d): Plot of Quantum Discord**
* **X-axis:** Normalized Pump Rate *p* - Logarithmic scale from 0.1 to 10.
* **Y-axis:** Quantum Discord *D* - Linear scale from 0.00 to 0.20.
* **Data Series (Legend - top-right):**
* positive-P: Black dots.
* truncated Wigner: Red dots.
* truncated Husimi: Blue dots.
* positive-P (MF-A): White dots.
### Detailed Analysis
**Figure (a): Schematic Diagram**
The diagram illustrates an experimental setup involving two beam splitters (IBS and XBS) and a main cavity. Pulses are injected and interact within the cavity. The delay line provides feedback, and the incident states are either vacuum or anti-squeezed vacuum states.
**Figure (b): Plot of Variance Product**
The plot shows the relationship between the variances of X and P. The curves represent constant values of the product of these variances. The blue line is below the green line.
* The blue line representing `(ΔX²)(ΔP²) = 0.25` starts at approximately `<ΔX²>` = 0.2, `<ΔP²>` = 0.8 and ends at `<ΔX²>` = 0.8, `<ΔP²>` = 0.3.
* The green line representing `(ΔX²)(ΔP²) = 0.3` starts at approximately `<ΔX²>` = 0.2, `<ΔP²>` = 0.9 and ends at `<ΔX²>` = 0.9, `<ΔP²>` = 0.3.
**Figure (c): Plot of Entanglement**
The plot shows how entanglement (ε/2) varies with the normalized pump rate *p*. All three data series (positive-P, truncated Wigner, and truncated Husimi) exhibit a similar trend:
* Initially, entanglement is high (close to 1.0) at low pump rates (around 0.1).
* As the pump rate increases, entanglement decreases, reaching a minimum around *p* = 1.
* Beyond *p* = 1, entanglement increases again, approaching 1.0 at high pump rates (around 10).
* The minimum entanglement value is approximately 0.86 at p=1.
**Figure (d): Plot of Quantum Discord**
The plot shows how quantum discord *D* varies with the normalized pump rate *p*. The data series exhibit the following trends:
* All data series start near 0 at low pump rates (around 0.1).
* As the pump rate increases, quantum discord increases sharply, reaching a maximum around *p* = 1.
* Beyond *p* = 1, quantum discord decreases, approaching 0 at high pump rates (around 10).
* The maximum quantum discord value is approximately 0.18 at p=1.
### Key Observations
* The schematic diagram illustrates the experimental setup for generating and manipulating quantum states of light.
* The variance product plot shows the uncertainty relationship between the variances of X and P.
* The entanglement plot shows that entanglement is high at both low and high pump rates, with a minimum around *p* = 1.
* The quantum discord plot shows that quantum discord is maximized around *p* = 1 and approaches zero at both low and high pump rates.
* The different theoretical approaches (positive-P, truncated Wigner, truncated Husimi, and positive-P (MF-A)) yield similar results for both entanglement and quantum discord, especially at low and high pump rates.
### Interpretation
The data suggests that the normalized pump rate *p* plays a crucial role in determining the entanglement and quantum discord of the system. The observed trends indicate that there is an optimal pump rate (around *p* = 1) for maximizing quantum discord, while entanglement is generally high except around this optimal pump rate. The agreement between the different theoretical approaches suggests that the results are robust and not strongly dependent on the specific approximation used. The experiment and simulations demonstrate the generation and manipulation of non-classical states of light, which are essential for quantum information processing and quantum communication. The dip in entanglement and peak in quantum discord around p=1 may indicate a transition in the system's behavior or a change in the dominant physical processes.