## Heatmap Visualization: Layer L vs Layer L+1
### Overview
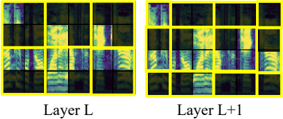
The image presents two side-by-side heatmaps labeled "Layer L" (left) and "Layer L+1" (right), each divided into a 3x3 grid of cells. Both heatmaps use a color gradient ranging from dark green (low values) to yellow (medium) to blue (high values). The grids are outlined with yellow borders, and the labels are positioned at the bottom center of each heatmap.
---
### Components/Axes
- **Labels**:
- "Layer L" (bottom-left heatmap)
- "Layer L+1" (bottom-right heatmap)
- **Grid Structure**:
- Both heatmaps contain 9 cells arranged in 3 rows and 3 columns.
- No explicit axis titles or numerical scales are visible.
- **Color Gradient**:
- Dark green → Yellow → Blue (inferred intensity scale, no legend present).
- **Positioning**:
- Heatmaps are aligned horizontally, with "Layer L" on the left and "Layer L+1" on the right.
- Labels are centered below their respective heatmaps.
---
### Detailed Analysis
#### Layer L (Left Heatmap)
- **Top Row**:
- Left cell: Predominantly dark green (low values).
- Middle cell: Mix of dark green and yellow (moderate variation).
- Right cell: Dark green with faint yellow streaks.
- **Middle Row**:
- Left cell: Vertical yellow streaks on dark green background.
- Middle cell: Horizontal yellow streaks with dark green base.
- Right cell: Vertical yellow streaks with dark green base.
- **Bottom Row**:
- Left cell: Dark green with faint yellow horizontal lines.
- Middle cell: Dark green with faint vertical yellow lines.
- Right cell: Dark green with faint diagonal yellow lines.
#### Layer L+1 (Right Heatmap)
- **Top Row**:
- Left cell: Vertical yellow streaks on dark green.
- Middle cell: Horizontal yellow streaks with dark green base.
- Right cell: Vertical yellow streaks with dark green base.
- **Middle Row**:
- Left cell: Horizontal yellow streaks with dark green base.
- Middle cell: Dominant yellow with dark green base.
- Right cell: Vertical yellow streaks with dark green base.
- **Bottom Row**:
- Left cell: Vertical yellow streaks with dark green base.
- Middle cell: Horizontal yellow streaks with dark green base.
- Right cell: Vertical yellow streaks with dark green base.
---
### Key Observations
1. **Layer L+1 shows higher overall intensity**:
- More cells in Layer L+1 exhibit yellow/blue hues compared to Layer L.
- Example: The middle row of Layer L+1 has two cells with dominant yellow, while Layer L’s middle row has only one.
2. **Bottom-right cell divergence**:
- Layer L’s bottom-right cell has faint diagonal yellow lines on dark green.
- Layer L+1’s bottom-right cell shows vertical yellow streaks, indicating a significant increase in activity.
3. **Middle row trend**:
- Layer L+1’s middle row has a consistent yellow streak pattern, suggesting a systematic change or activation.
4. **Color consistency**:
- Dark green dominates Layer L, while Layer L+1 shifts toward yellow/blue, implying a progression or transformation between layers.
---
### Interpretation
The heatmaps likely represent feature maps or activation patterns in a neural network, where Layer L+1 builds upon Layer L. The increased yellow/blue intensity in Layer L+1 suggests enhanced feature extraction or activation in specific regions. The middle row’s consistent yellow streaks in Layer L+1 may indicate a localized transformation or pooling operation. The bottom-right cell’s dramatic shift from faint diagonal lines (Layer L) to vertical streaks (Layer L+1) could represent a critical feature amplification or edge detection. The absence of a legend limits precise quantification, but the relative color intensity differences highlight a clear progression between layers.