\n
## Diagram: Mixture of Experts (MoE) System Flow
### Overview
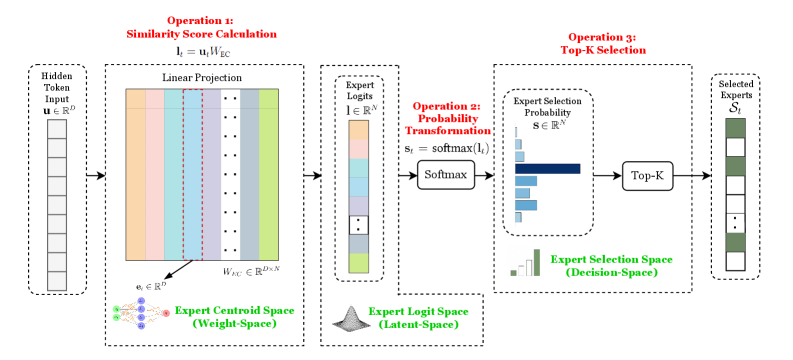
The image depicts a diagram illustrating the flow of data through a Mixture of Experts (MoE) system. The system consists of three main operations: Similarity Score Calculation, Probability Transformation, and Top-K Selection. The diagram shows how a hidden token input is processed through a linear projection to generate expert logits, which are then transformed into probabilities, and finally used to select a subset of experts.
### Components/Axes
The diagram is segmented into three main operational blocks, labeled "Operation 1: Similarity Score Calculation", "Operation 2: Probability Transformation", and "Operation 3: Top-K Selection". Each block contains several components:
* **Hidden Token Input:** Represented as `u ∈ R^d` (a vector in d-dimensional space).
* **Linear Projection:** Depicted as a matrix multiplication with `W_l ∈ R^(d x P)` where P is the number of experts.
* **Expert Logits:** Represented as `l ∈ R^P`.
* **Expert Selection Probability:** Represented as `s_i = softmax(l)` and `s ∈ R^P`.
* **Selected Experts:** Represented as `S_i`.
* **Expert Centroid Space (Weight-Space):** A scatter plot showing expert centroids.
* **Expert Logit Space (Latent-Space):** A visual representation of the expert logits.
* **Expert Selection Space (Decision-Space):** A bar chart representing the expert selection probabilities.
The diagram also includes mathematical equations:
* `l_i = u_i * W_l` (Similarity Score Calculation)
* `s_i = softmax(l)` (Probability Transformation)
### Detailed Analysis / Content Details
The diagram illustrates a data flow from left to right.
1. **Operation 1: Similarity Score Calculation:** A hidden token input `u ∈ R^d` (represented as a vertical stack of numbers) is linearly projected using a weight matrix `W_l ∈ R^(d x P)` (represented as colored vertical bars). This results in expert logits `l ∈ R^P`. The colors of the bars in `W_l` are: yellow, orange, light blue, dark blue, green. The expert centroid space (Weight-Space) shows a scatter plot of expert centroids, with points clustered in different regions.
2. **Operation 2: Probability Transformation:** The expert logits `l` are passed through a softmax function to generate expert selection probabilities `s_i = softmax(l)`, represented as `s ∈ R^P`. This is visually depicted as a bar chart in the "Expert Selection Space (Decision-Space)". The bar chart shows varying probabilities for each expert.
3. **Operation 3: Top-K Selection:** A "Top-K" operation selects the top K experts based on their probabilities. The selected experts `S_i` are represented as a vertical stack of colored blocks, with the colors corresponding to the experts selected. The arrow indicates that only a subset of experts are chosen.
The diagram uses dotted arrows to indicate the flow of data between operations.
### Key Observations
* The system uses a linear projection to map the hidden token input to the expert logit space.
* The softmax function is used to convert logits into probabilities, representing the relevance of each expert.
* The Top-K selection mechanism allows the system to focus on a subset of experts for each input.
* The diagram highlights the transformation of data from the input space to the latent space and then to the decision space.
### Interpretation
The diagram illustrates a key component of Mixture of Experts models, which aim to improve model capacity and performance by dividing the task among multiple experts. The MoE architecture allows the model to specialize in different aspects of the data, leading to more efficient and accurate predictions. The diagram demonstrates how the input is routed to the most relevant experts based on a similarity score and a probability distribution. The Top-K selection ensures that only a limited number of experts are activated for each input, reducing computational cost. The visual representation of the different spaces (Weight-Space, Latent-Space, Decision-Space) provides a clear understanding of the data transformation process within the MoE system. The diagram is a conceptual illustration and does not contain specific numerical data, but rather focuses on the functional flow and mathematical operations involved.