\n
## Line Chart: Validation Accuracy
### Overview
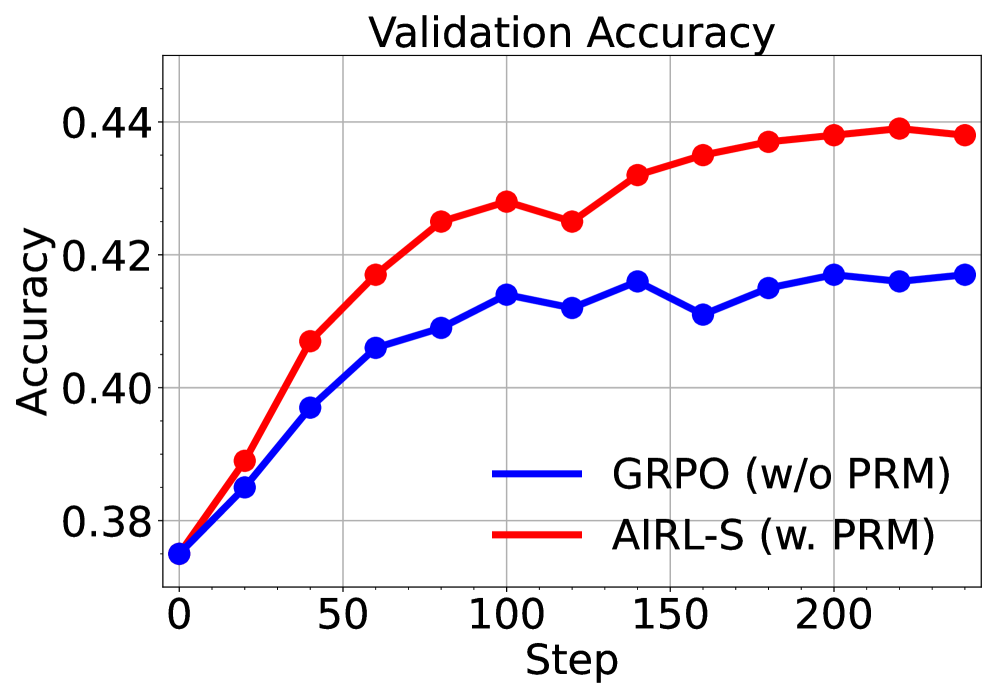
This image presents a line chart illustrating the validation accuracy of two different models, GRPO (without PRM) and AIRL-S (with PRM), over a series of steps. The chart displays how the accuracy of each model changes as the training progresses, measured by the 'Step' value on the x-axis.
### Components/Axes
* **Title:** "Validation Accuracy" - positioned at the top-center of the chart.
* **X-axis:** "Step" - ranging from approximately 0 to 220, with tick marks at intervals of 50.
* **Y-axis:** "Accuracy" - ranging from approximately 0.38 to 0.44, with tick marks at intervals of 0.02.
* **Legend:** Located in the top-right corner of the chart.
* **GRPO (w/o PRM):** Represented by a blue line.
* **AIRL-S (w. PRM):** Represented by a red line.
### Detailed Analysis
**AIRL-S (w. PRM) - Red Line:**
The red line representing AIRL-S exhibits an upward trend, starting at approximately 0.38 at Step 0. It increases relatively quickly to around 0.42 by Step 50, then continues to rise more gradually, reaching approximately 0.435 by Step 100. The line plateaus around 0.438-0.44 between Steps 150 and 200, with a slight fluctuation.
* Step 0: ~0.38
* Step 50: ~0.42
* Step 100: ~0.435
* Step 150: ~0.438
* Step 200: ~0.44
**GRPO (w/o PRM) - Blue Line:**
The blue line representing GRPO also shows an upward trend, but it is less pronounced than that of AIRL-S. It starts at approximately 0.38 at Step 0 and increases to around 0.41 by Step 50. The line then plateaus, with minor fluctuations, reaching approximately 0.425 by Step 100 and remaining around that level until Step 200, with a slight increase to ~0.428.
* Step 0: ~0.38
* Step 50: ~0.41
* Step 100: ~0.425
* Step 150: ~0.426
* Step 200: ~0.428
### Key Observations
* AIRL-S consistently outperforms GRPO throughout the entire training process.
* The accuracy of AIRL-S increases rapidly in the initial stages (Steps 0-50) and then stabilizes.
* GRPO shows a slower and less significant increase in accuracy, plateauing at a lower level than AIRL-S.
* Both models start with the same accuracy at Step 0.
### Interpretation
The data suggests that incorporating PRM (as in AIRL-S) significantly improves the validation accuracy compared to not using PRM (as in GRPO). The faster initial increase in accuracy for AIRL-S indicates that PRM helps the model learn more effectively in the early stages of training. The plateauing of both lines suggests that the models are converging, and further training may not yield substantial improvements. The consistent difference in accuracy between the two models highlights the benefit of using PRM in this context. The chart demonstrates the effectiveness of the AIRL-S model with PRM in achieving higher validation accuracy compared to the GRPO model without PRM.